Diabetes risk prediction
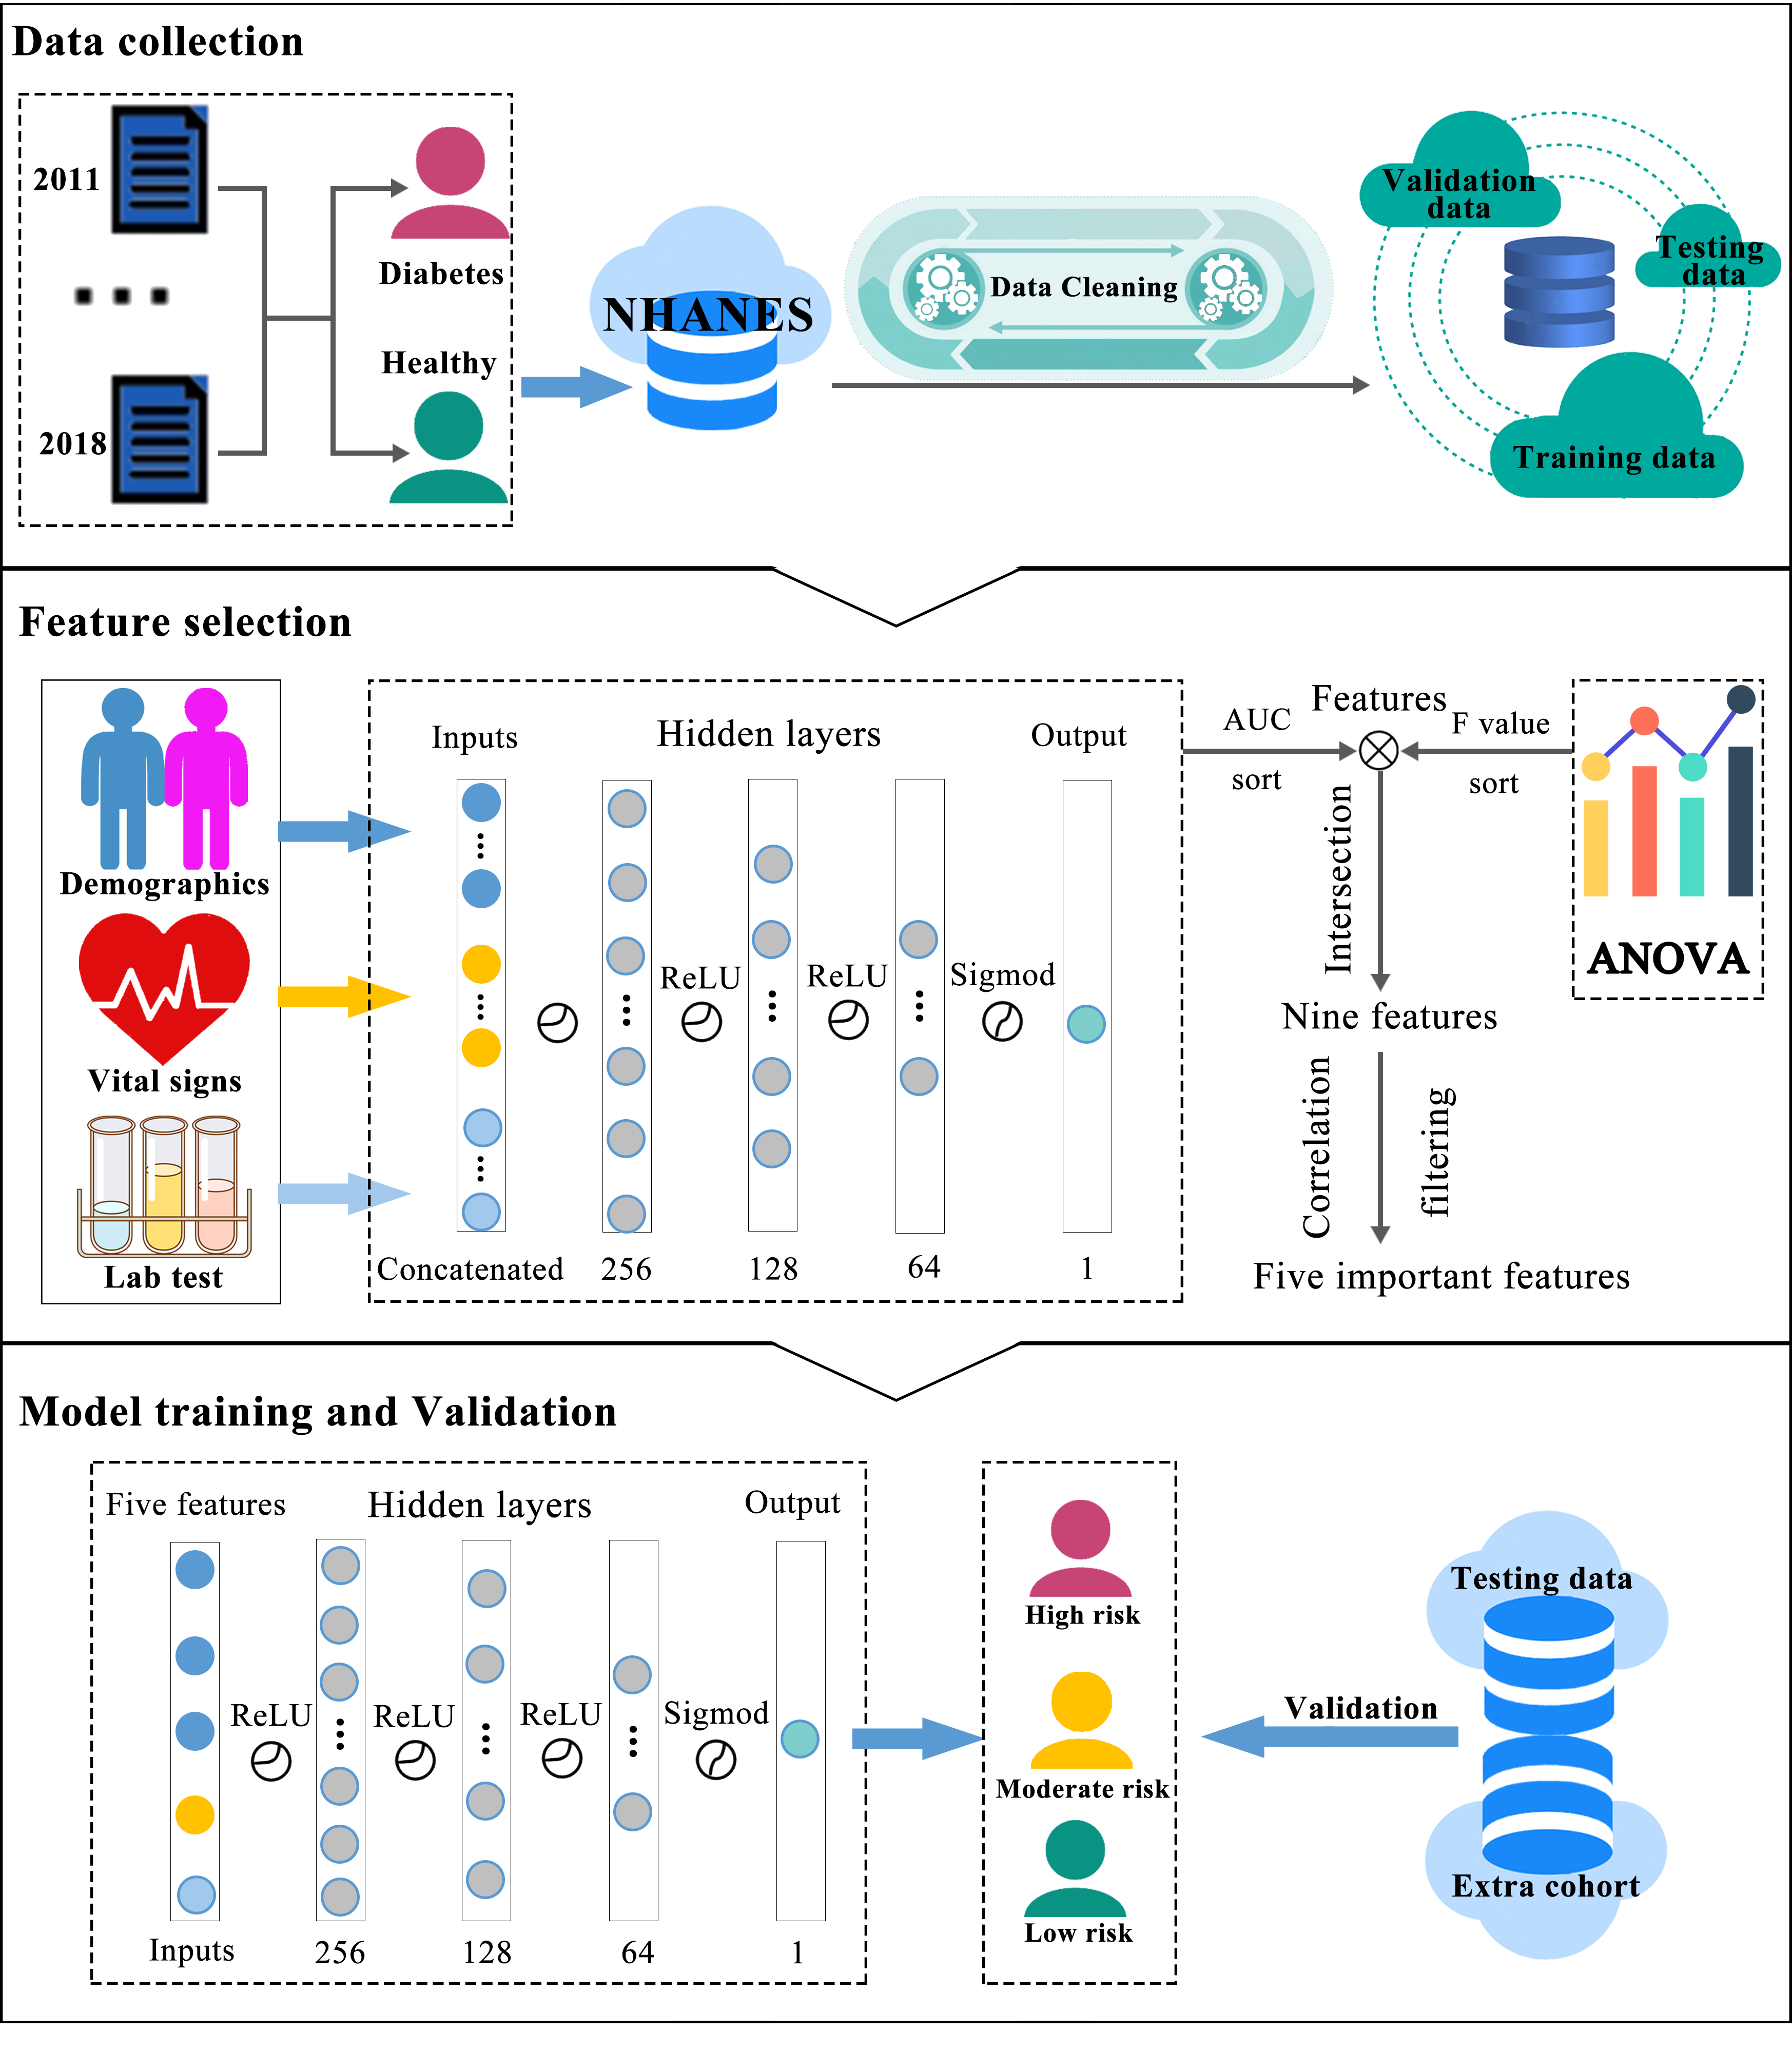
The workflow of theDRPM is as follows: Data from the NHANES dataset spanning 2011 to 2018 were first collected, followed by preprocessing, which resulted in the division of the data into training, validation, and test subsets. The extracted features encompass statistical, physiological, and laboratory features. Following the feature extraction process, five key features were selected for model construction. Finally, a deep learning model was employed to develop a risk prediction model.
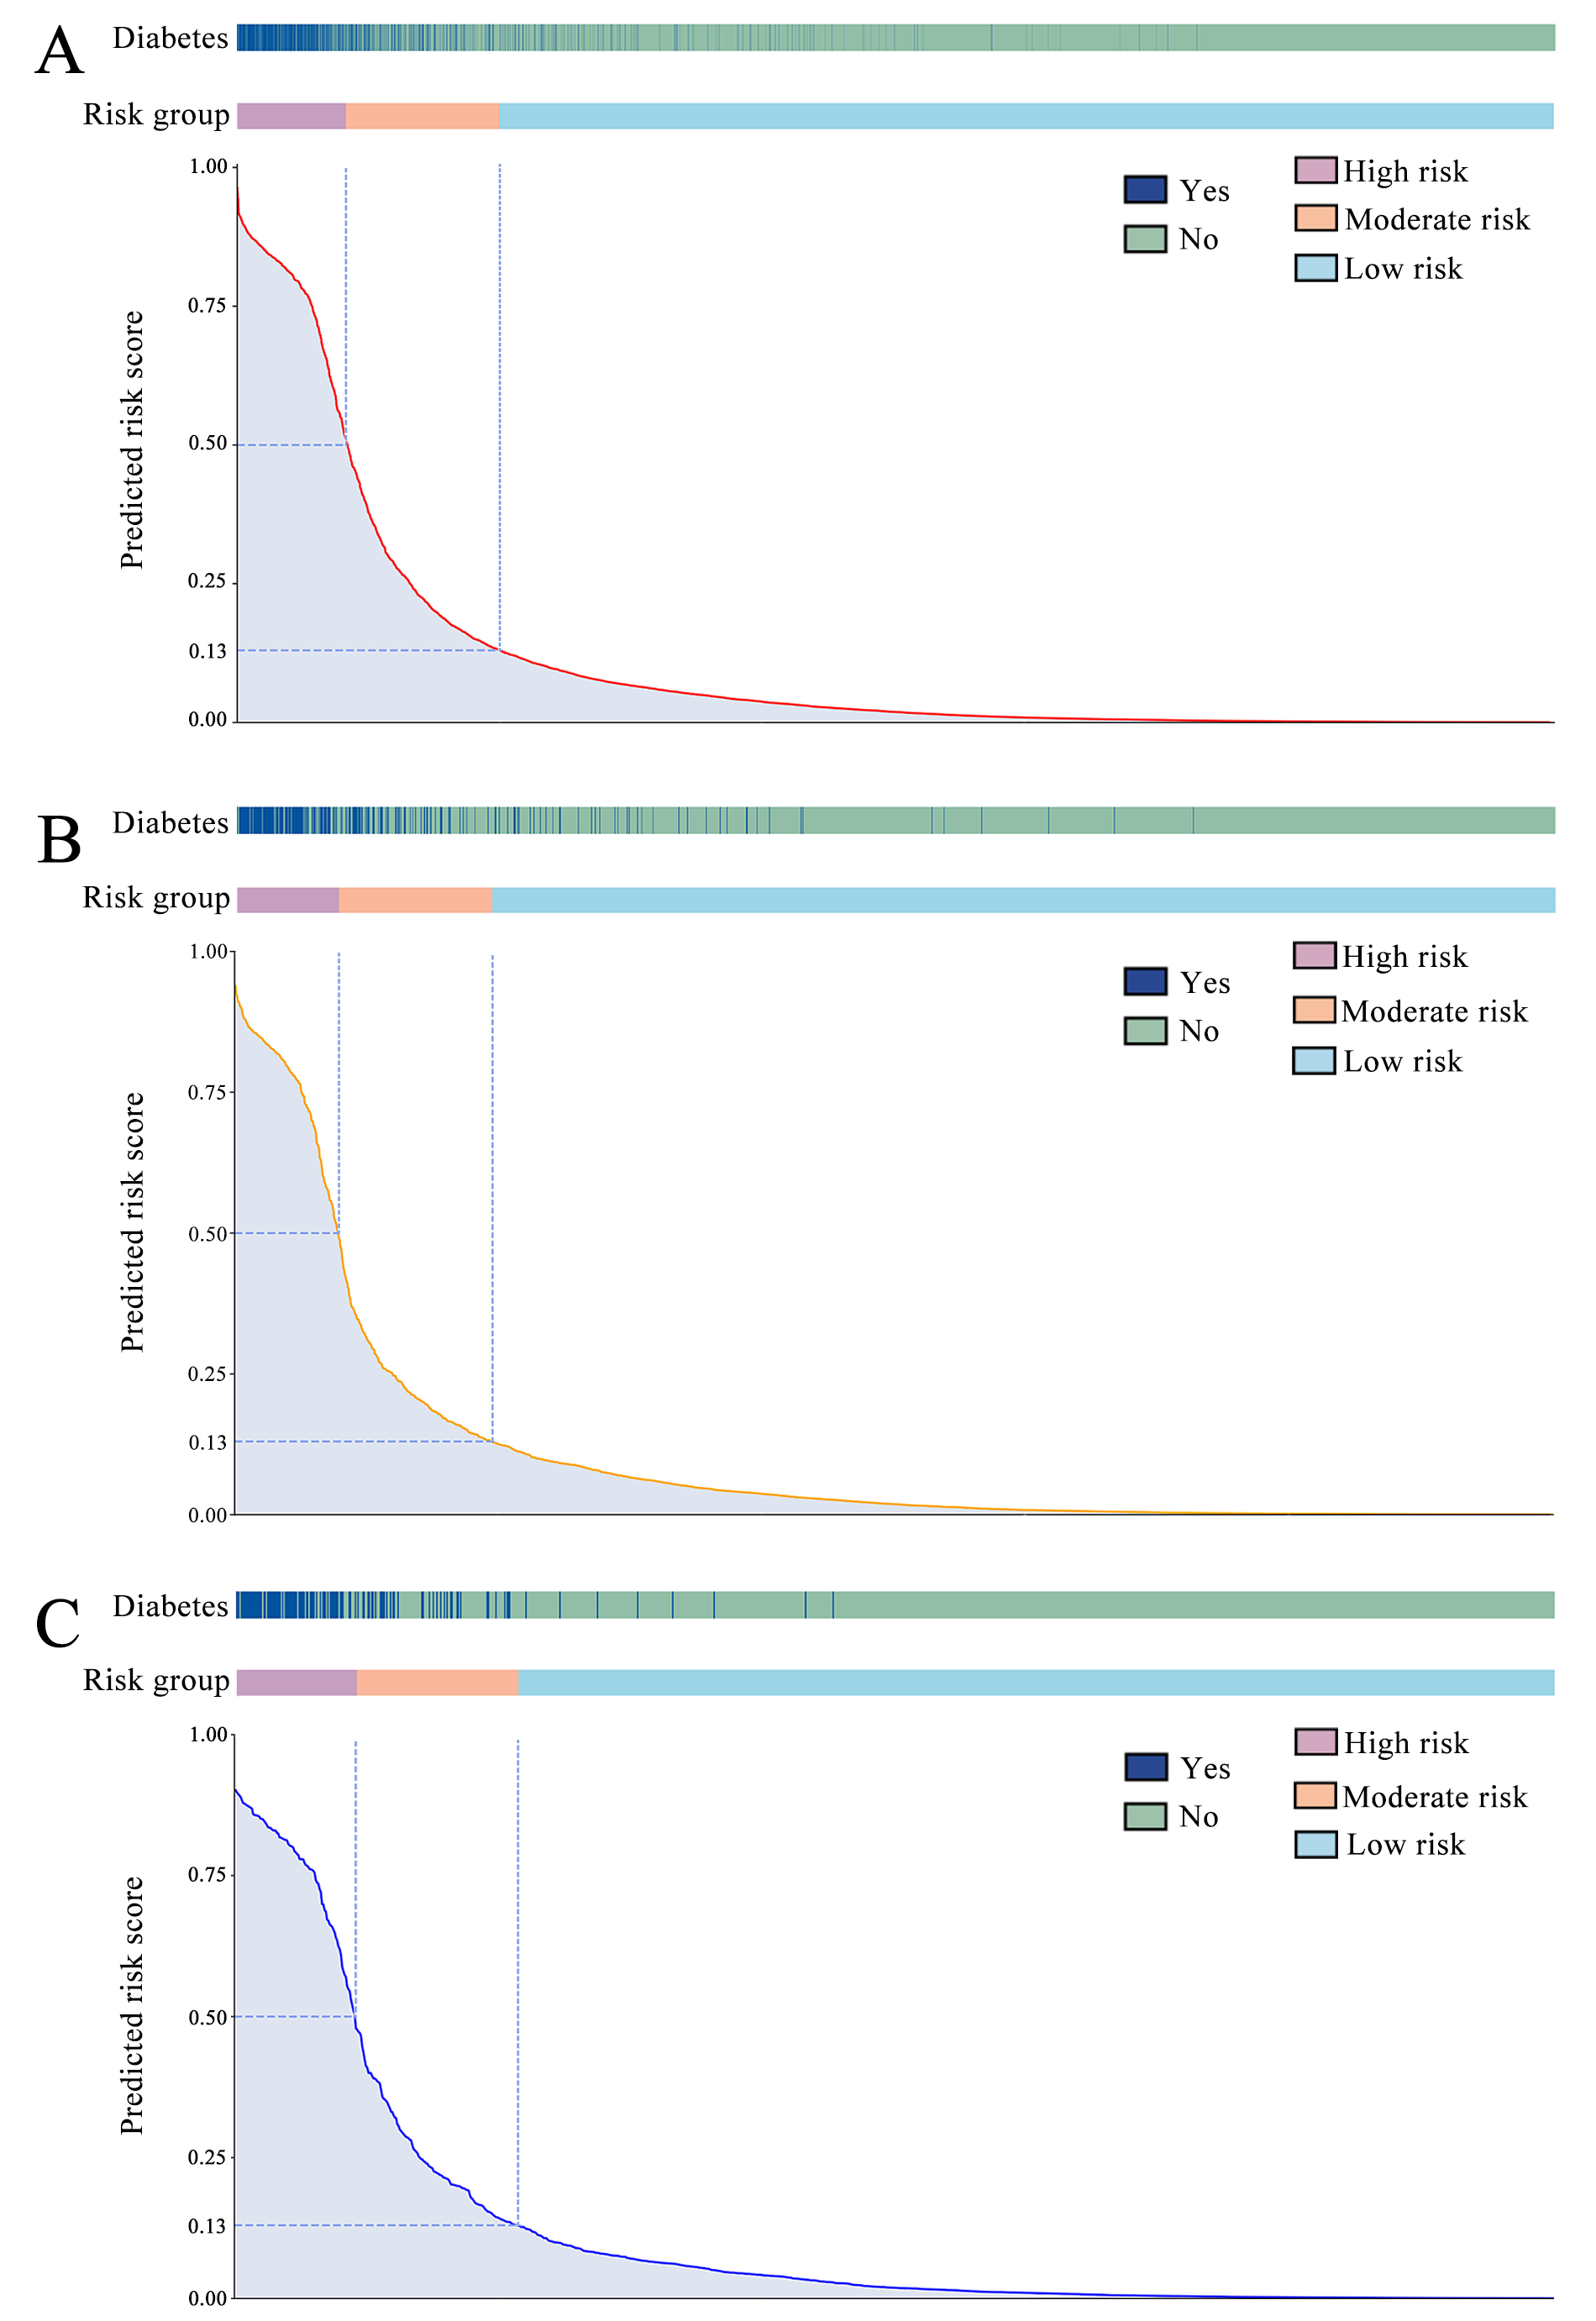
In accordance with the diabetes model training process, a risk threshold of 0.5 was established to determine the presence of diabetes. Individuals with a predicted risk score (PRS) exceeding 0.5 were classified as high-risk. Individuals with a PRS of 0.13 or lower were classified as low-risk, while those with a PRS greater than 0.13 but less than or equal to 0.5 were classified as moderate-risk. (A) Distribution of predicted risk scores and risk groups in the training dataset. (B) Distribution of predicted risk scores and risk groups in the validation dataset. (C) Distribution of predicted risk scores and risk groups in the testing dataset.
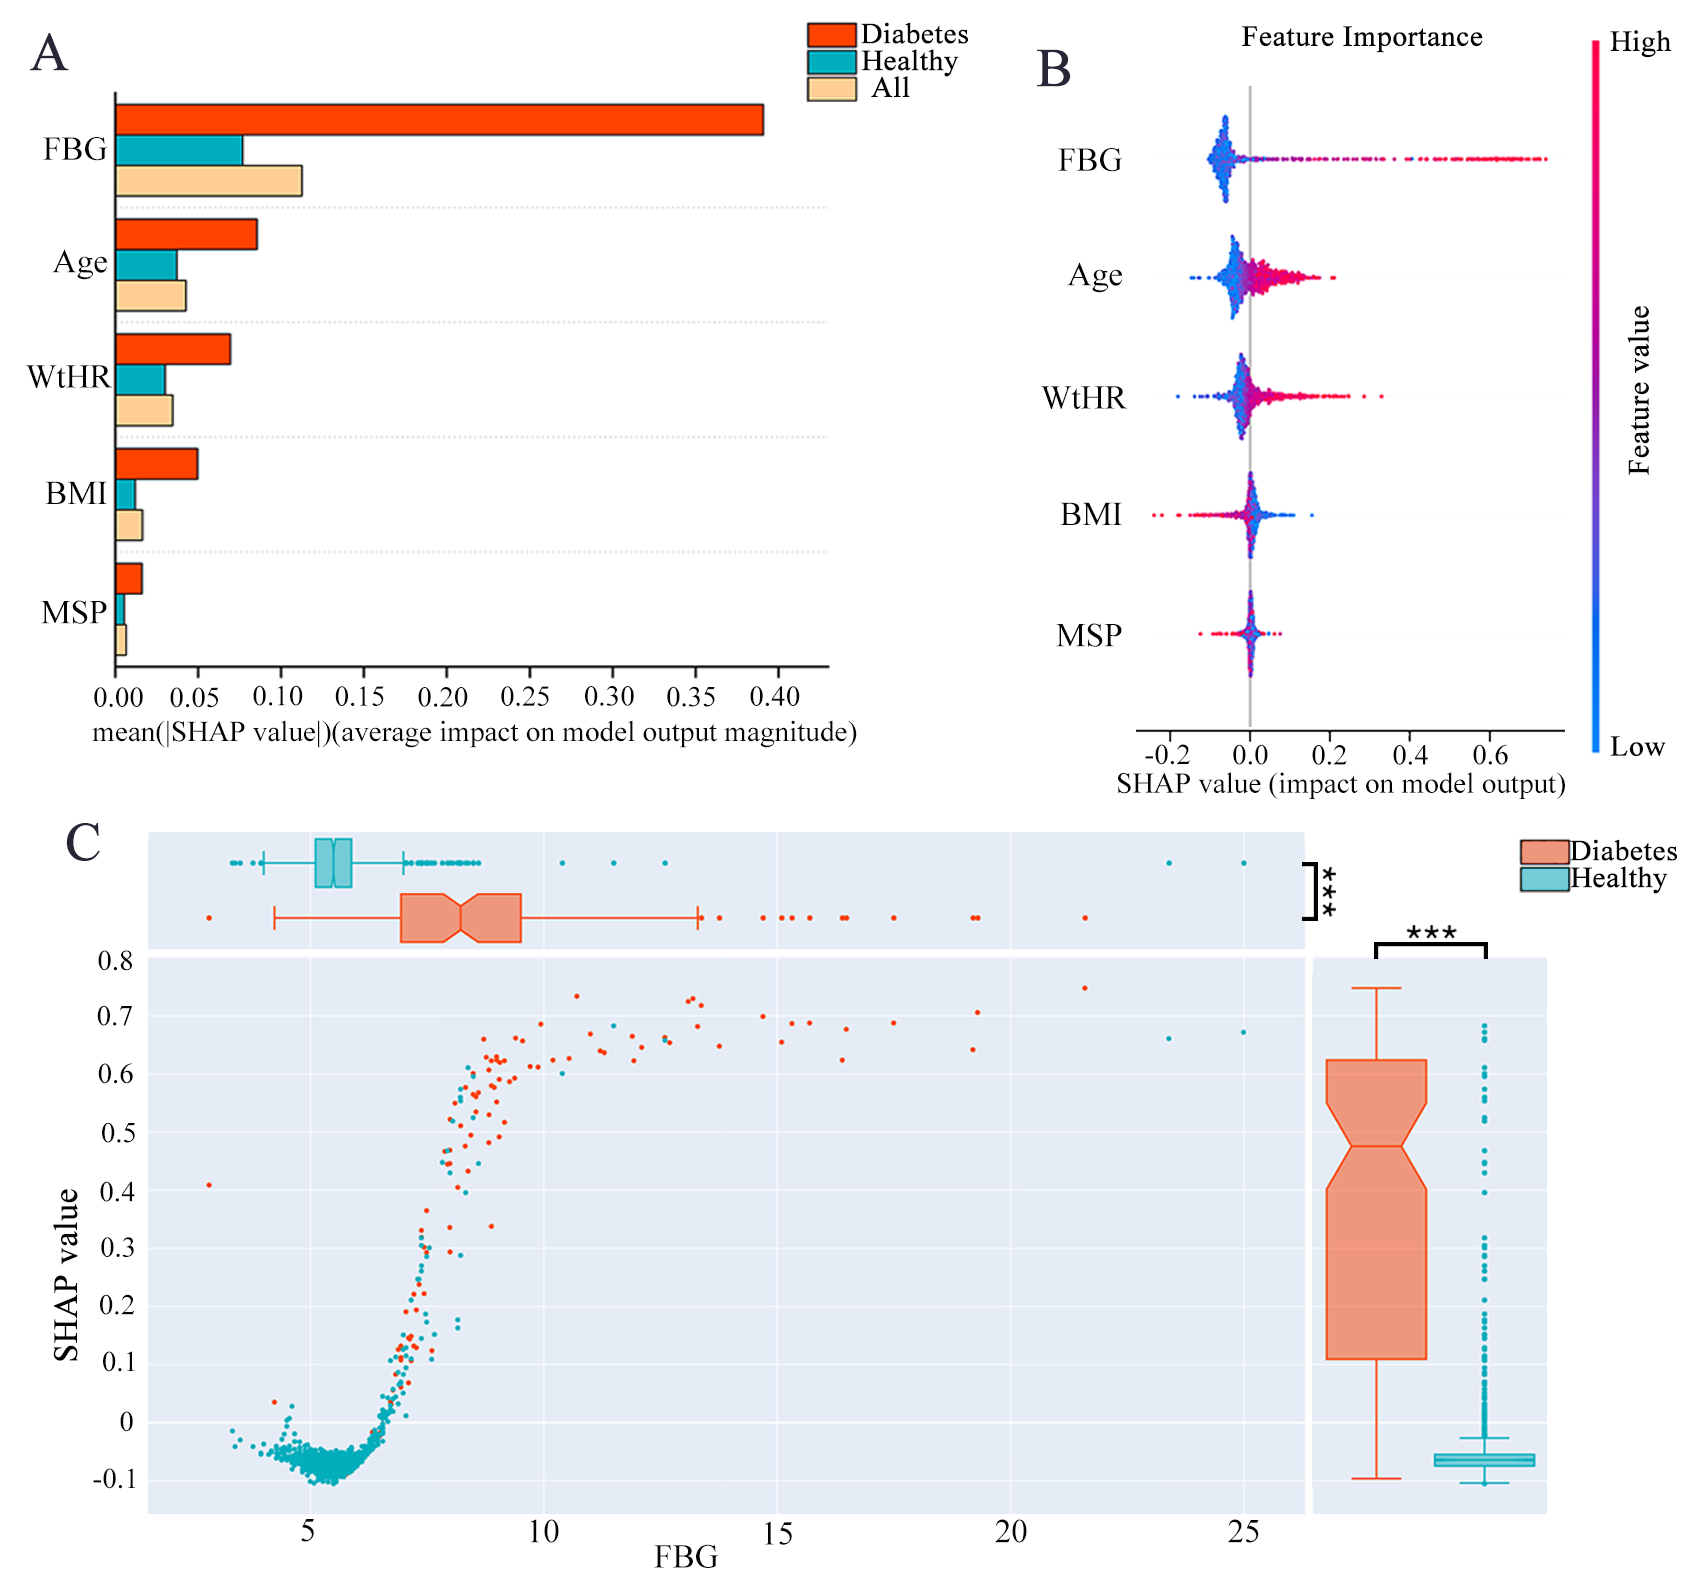
(A) Relative importance of the five important variables in the final model. A similar importance can be shown in diabetes or healthy dataset. (B) Global explainability of the model for the five features (in order of importance based on the mean of absolute SHAP values). (C) Contextualized SHAP values as a function of variable values for the FBG. Each dot represents an individual. The color indicates the diabetes or healthy individual. X-axis corresponds to the real value of the variable, while the Y-axis corresponds to the SHAP value given to this individual for this variable.