Help Guide for DeepICER
Using the Predict Tool
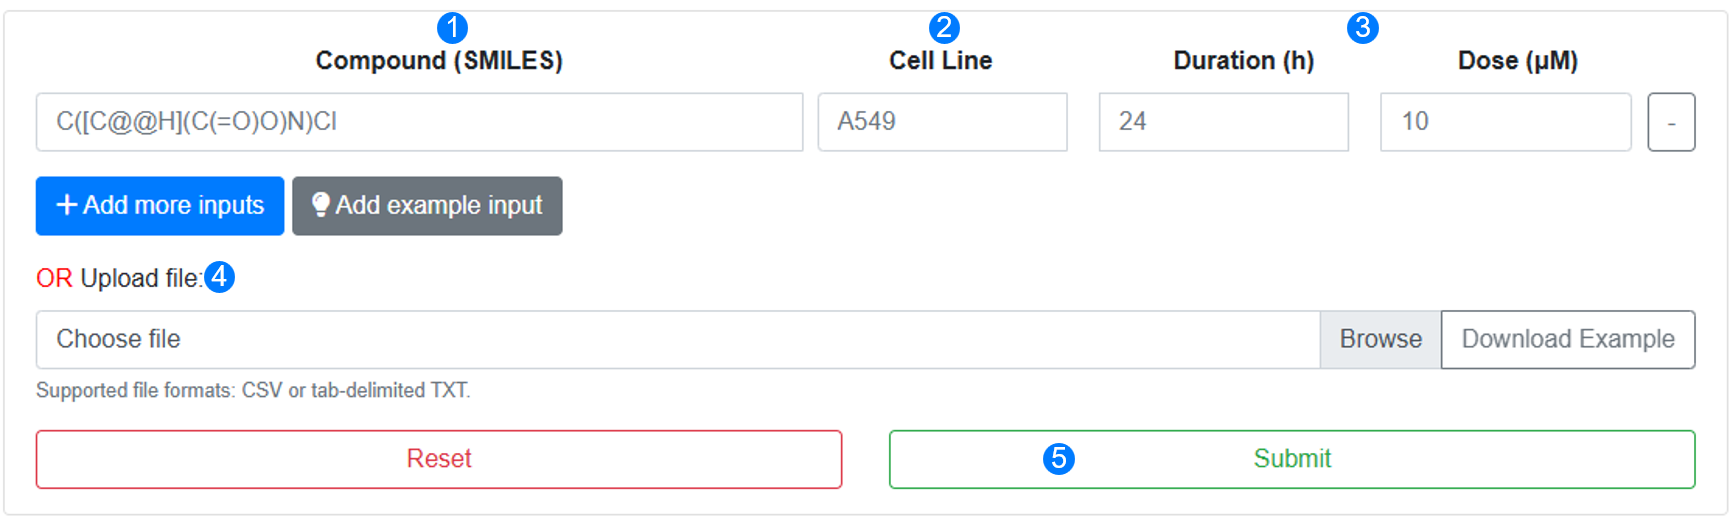
How to Use
- Enter the SMILES structure of the drug.
- Select a cell line from the dropdown menu.
- Input the duration (in hours) and dose (in μM).
- Alternatively, upload a file containing this information for batch processing.
- Click the "Submit" button to start the prediction.
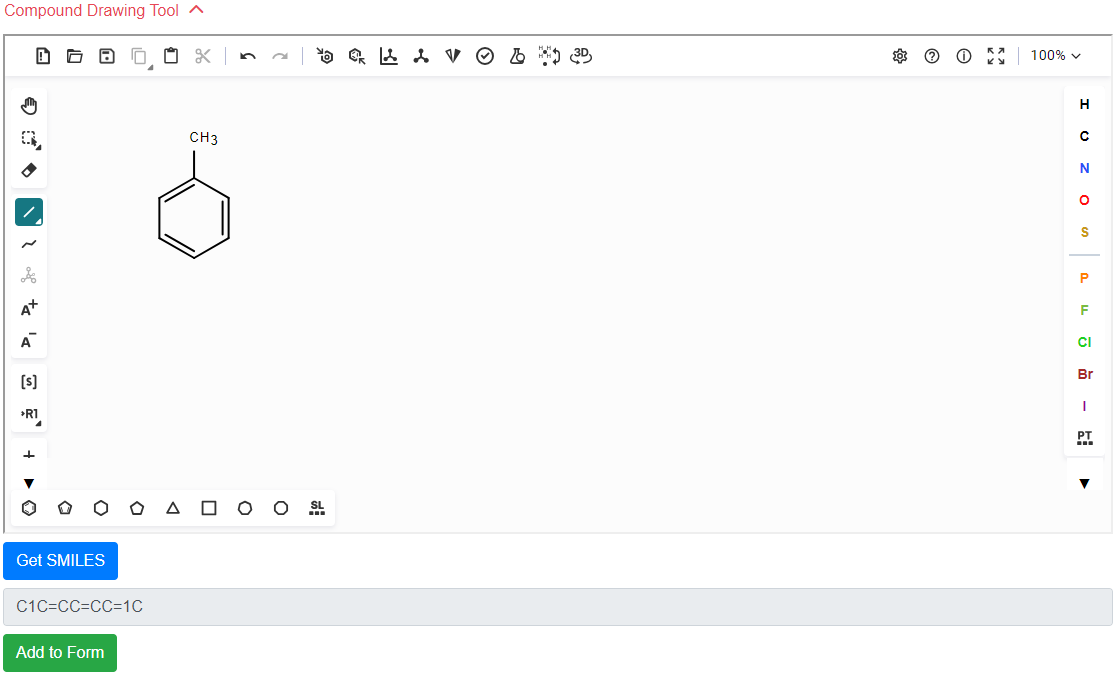
Using the Compound Drawing Tool
If you don't have the SMILES structure, you can use our Compound Drawing Tool to create your own compound structure. After drawing, click the "Get SMILES" button to generate the SMILES. Then click "Add to Form" to automatically add the SMILES to the prediction form.
Results Explanation
The predicted results are presented in a table.
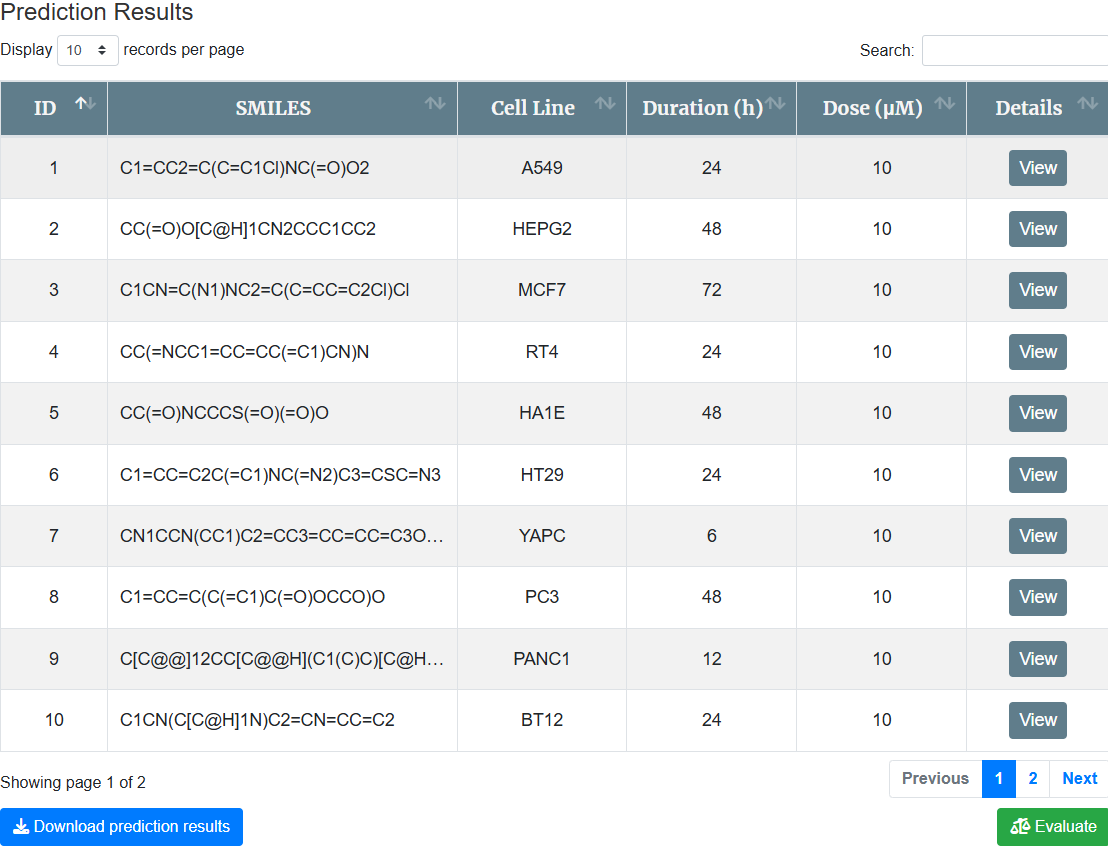
Users can download the results directly or click the "Evaluate" button to use the results on the evaluate page.
Detailed results are shown after clicking the "View" button.
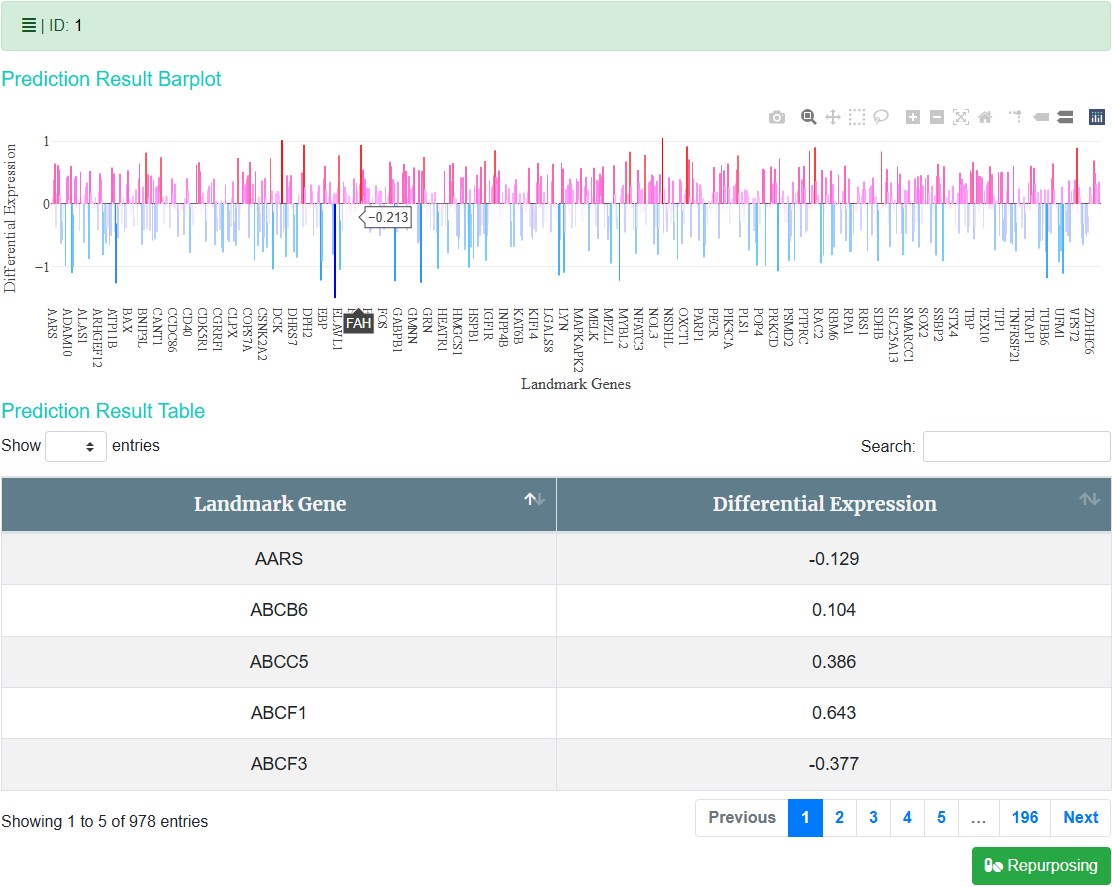
- Positive expression values indicate up-regulation, while negative values indicate down-regulation.
- Higher absolute values suggest stronger gene expression changes.
- Users can click the "Repurposing" button to use the results on the repurposing page.
Using the Evaluate Tool
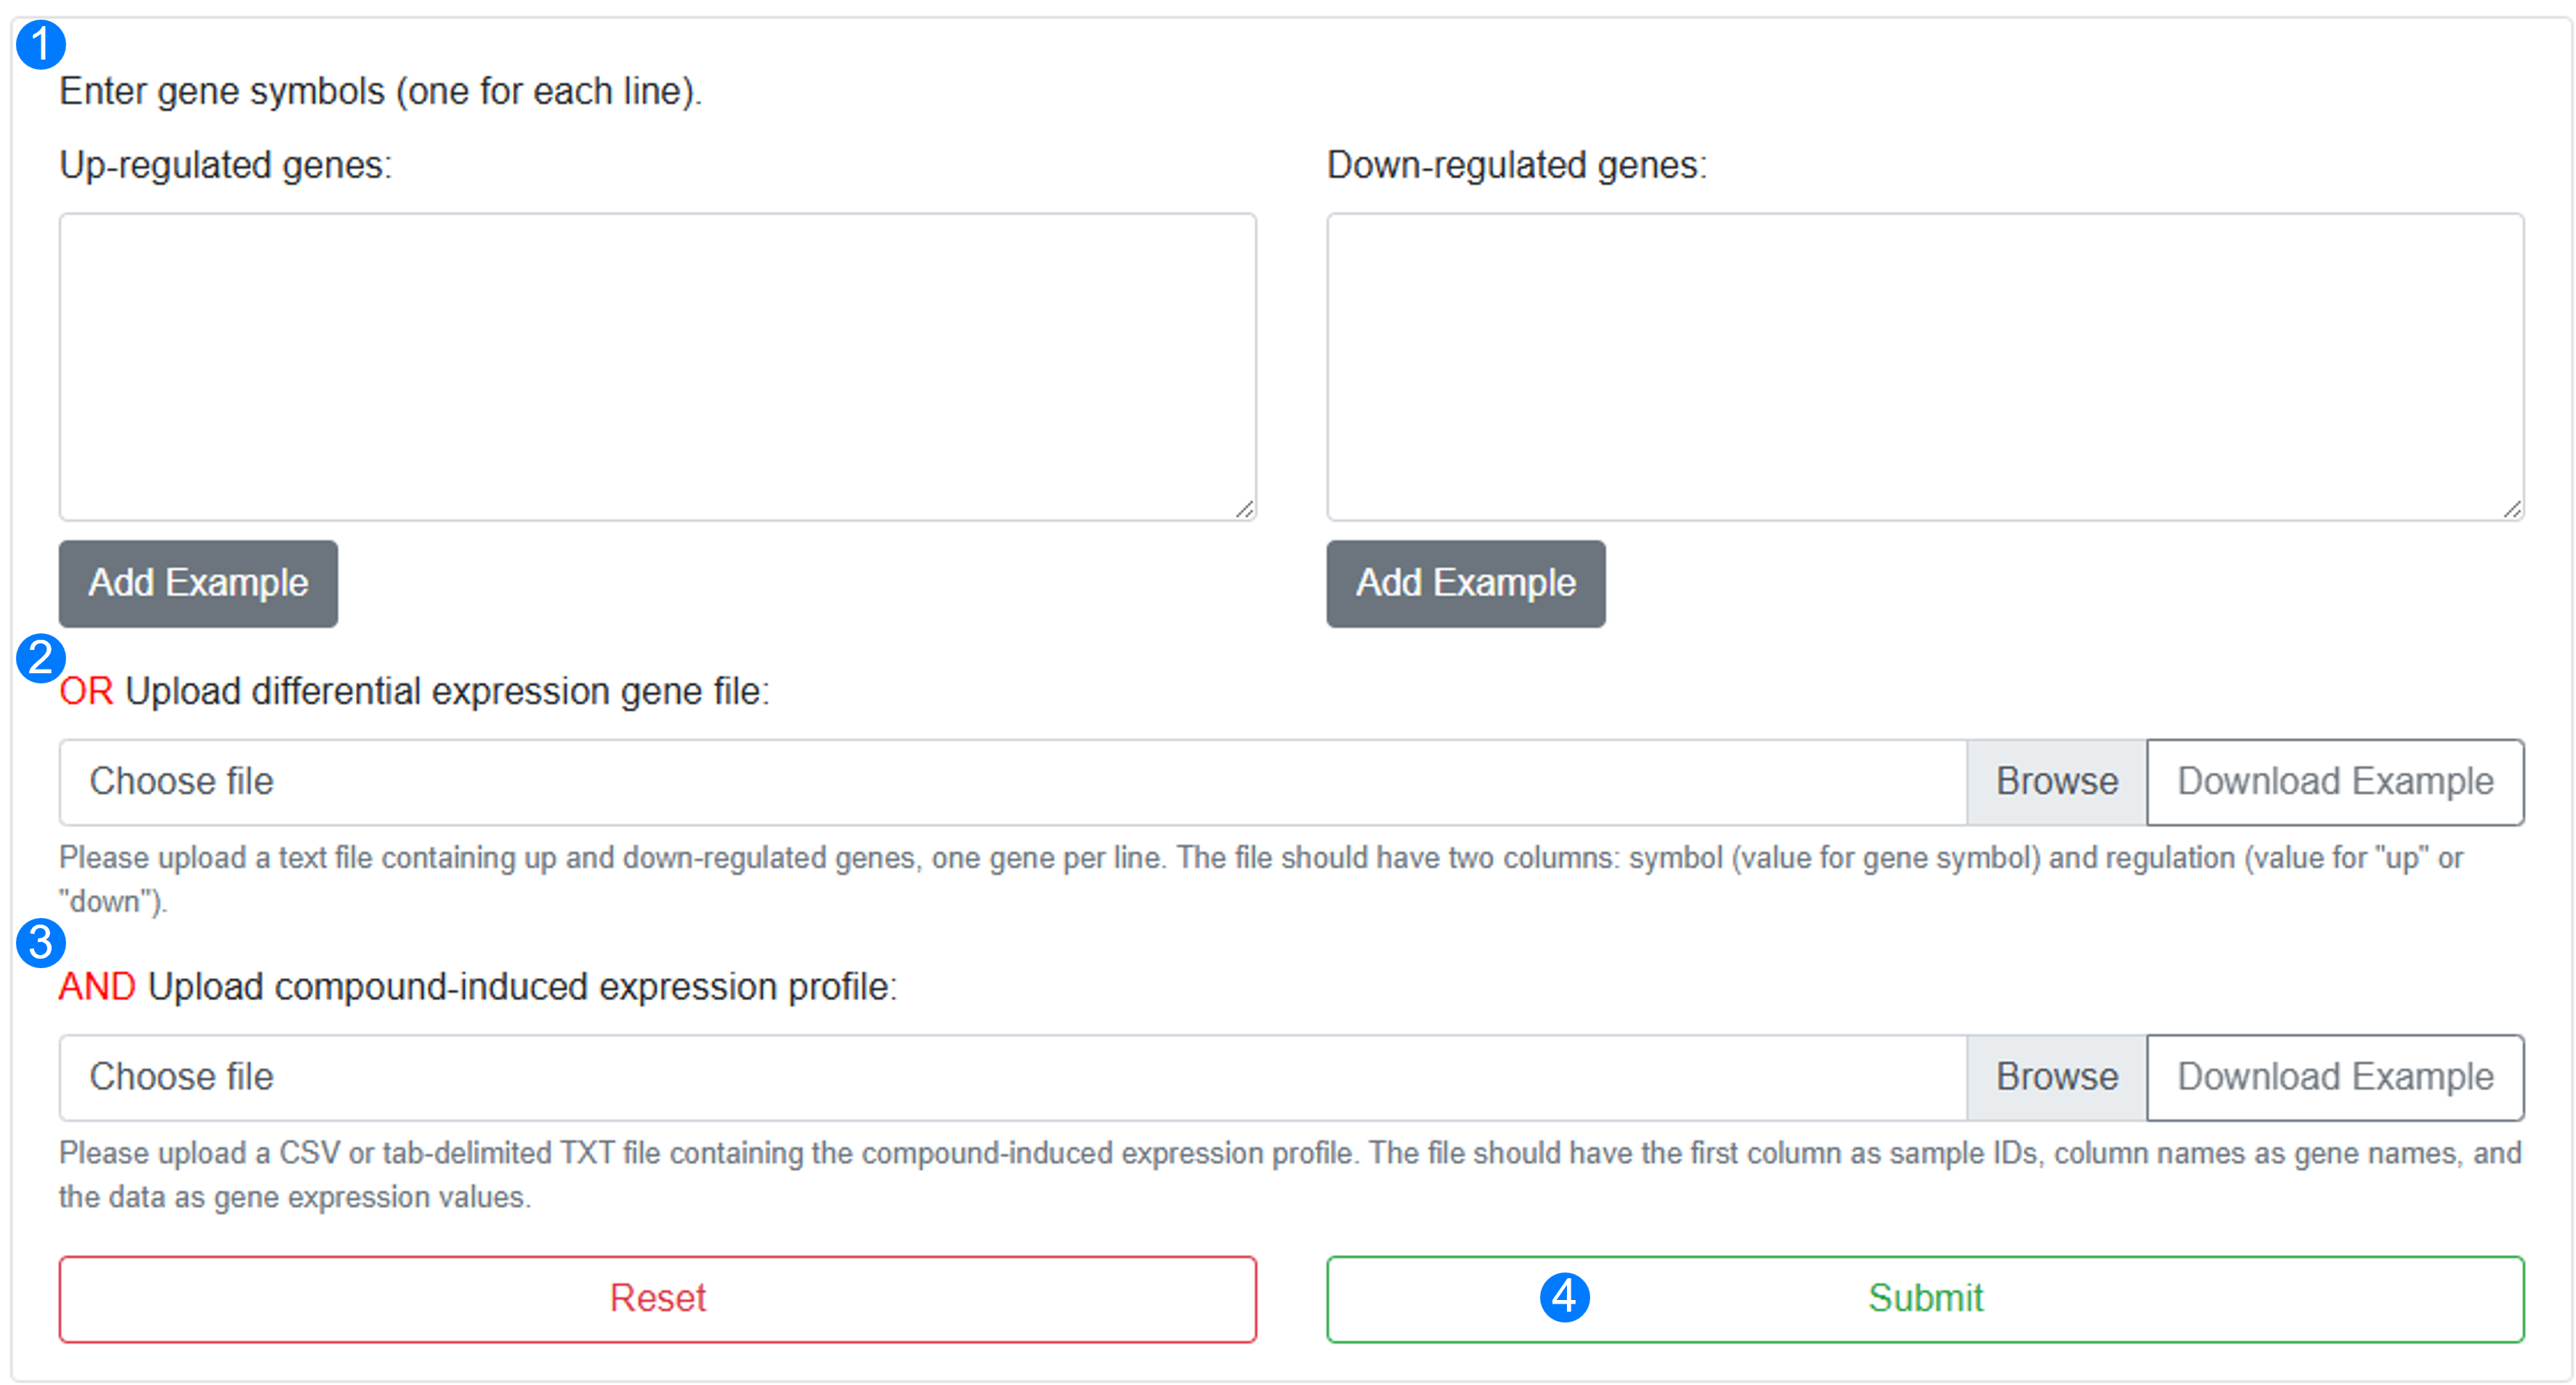
How to Use
- Enter the up-regulated gene list and down-regulated gene list.
- Alternatively, upload a file containing the up-regulated gene list and down-regulated gene list.
- If you have the predicted gene expression data, upload it. Otherwise, use the "Predict" tool to predict the gene expression data.
- Click the "Evaluate" button to start the analysis.
Results Explanation
The evaluation results are presented in a table.
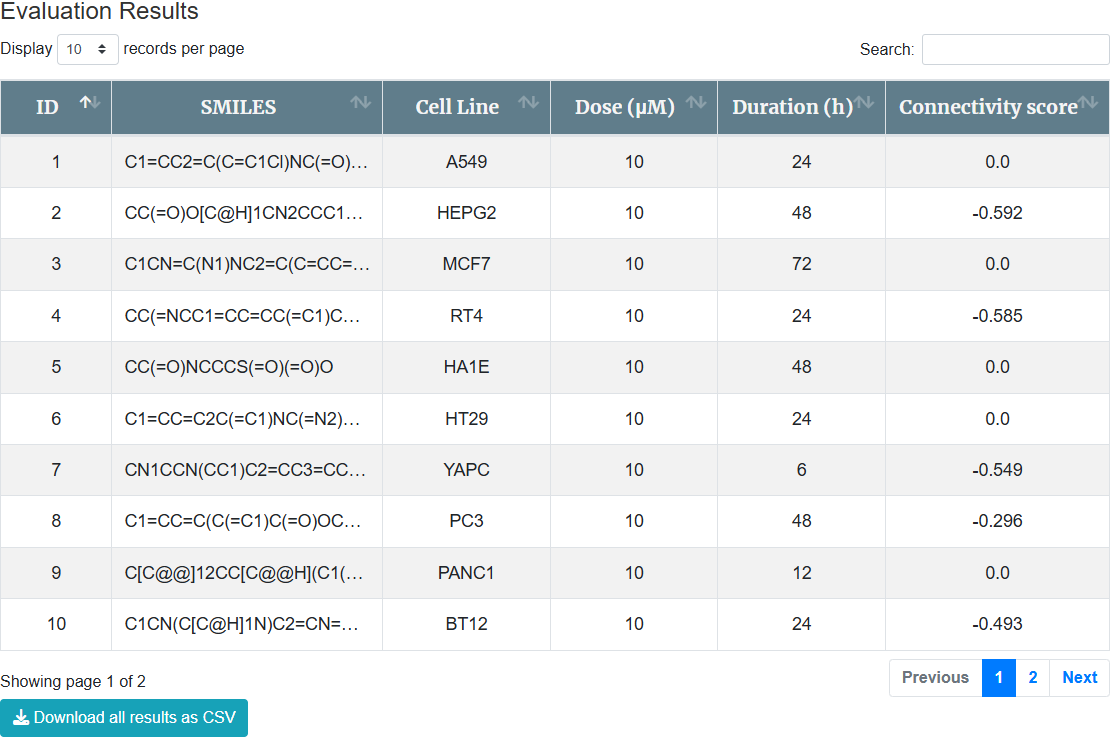
The connectivity score, derived from gene set enrichment analysis, quantifies the relationship between transcriptional profiles. This score spans from -1 to 1:
- A score of -1 indicates a complete inversion of the query profile compared to the reference profile.
- A score of 1 signifies perfect similarity between the query and reference profiles.
This scoring system allows us to measure the degree of relationship between different gene expression patterns. Negative values represent a reversal in gene expression patterns, while positive values indicate similarity. The closer the score is to either extreme (-1 or 1), the stronger the relationship, whether it's opposition or similarity.
Using the Repurposing Tool
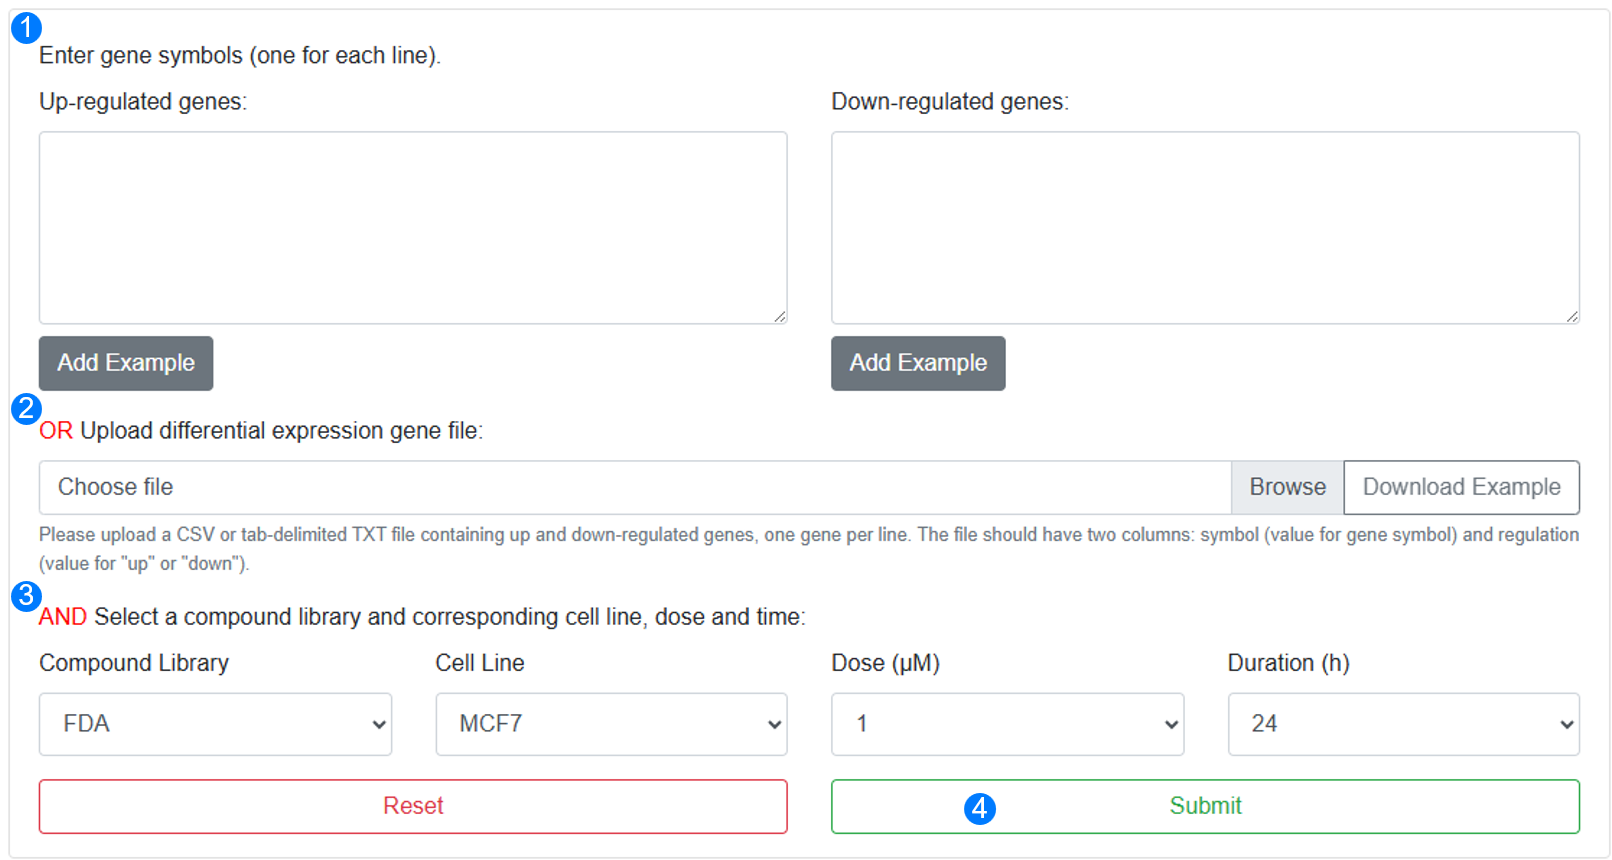
How to Use
- Enter the up-regulated gene list and down-regulated gene list.
- Alternatively, upload a file containing the up-regulated gene list and down-regulated gene list.
- Select a compound library and corresponding cell line, dose and duration.
- Click the "Submit" button to start the analysis.
Results Explanation
The repurposing results are presented in a table.
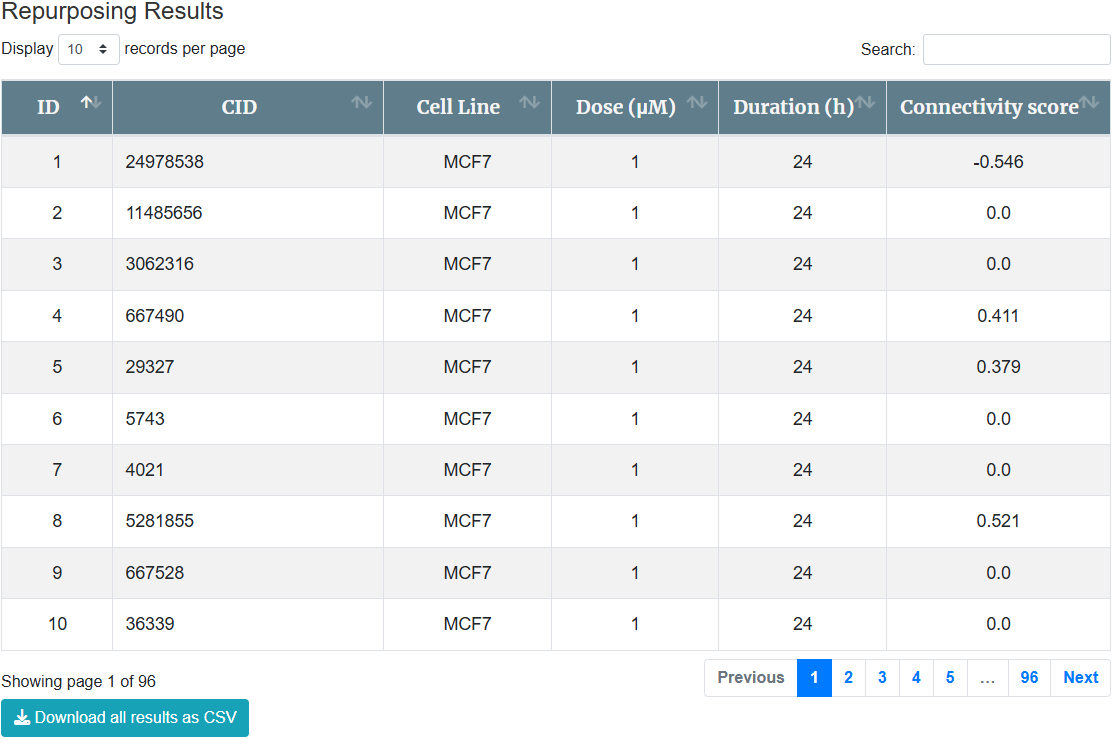
The connectivity score, derived from gene set enrichment analysis, quantifies the relationship between transcriptional profiles. This score spans from -1 to 1:
- A score of -1 indicates a complete inversion of the query profile compared to the reference profile.
- A score of 1 signifies perfect similarity between the query and reference profiles.
This scoring system allows us to measure the degree of relationship between different gene expression patterns. Negative values represent a reversal in gene expression patterns, while positive values indicate similarity. The closer the score is to either extreme (-1 or 1), the stronger the relationship, whether it's opposition or similarity.
Additional Information
For more detailed information about DeepICER, including methodology, limitations, and best practices, please refer to our recently publication on ### or contact our support team. Additionally, detailed parameters such as the software dependencies and versions used for training have been systematically organized and uploaded to the project's GitHub repository.