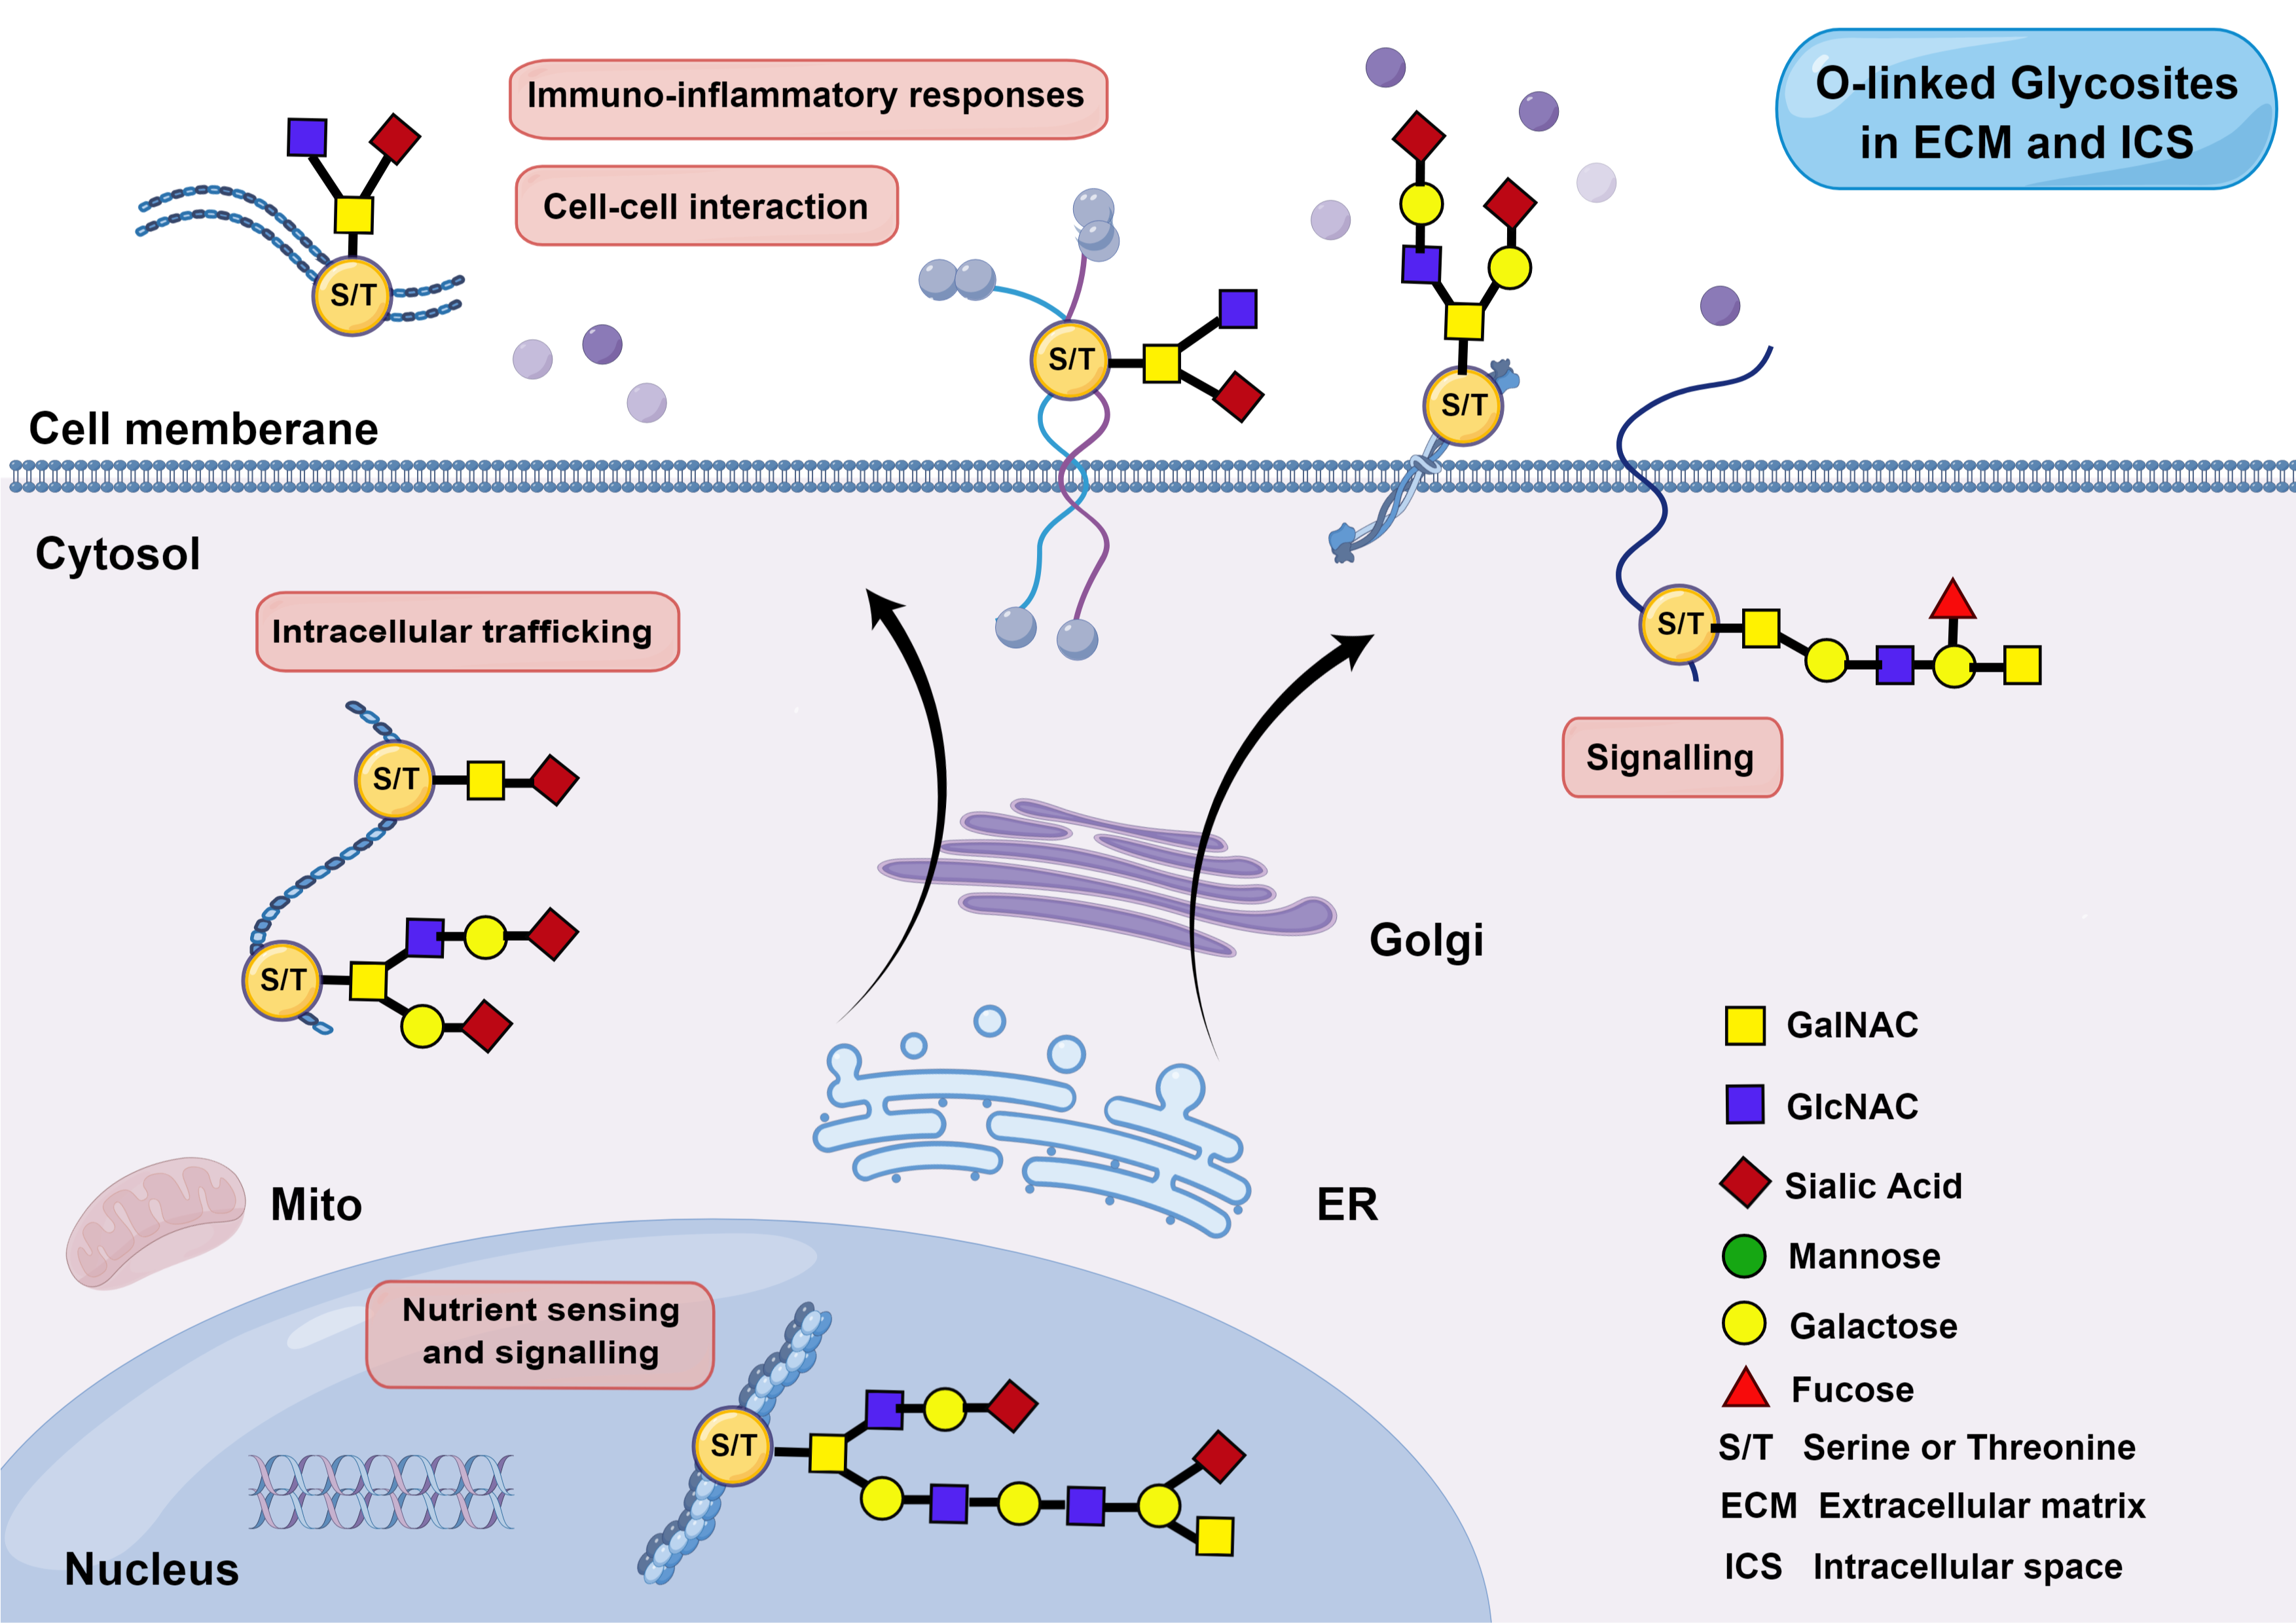
For O-linked glycosylation, the initiation event is the transfer of N-Acetylgalactosamine (N-GalNAc) to the hydroxyl of Serine (S) or Threonine (T) residues, followed by elongation and branching of glycan chains via adding glycosyl one by one. Occurring in cytoplasm, nucleus, secretory and membrane-binding proteins, O-glycosylation can reversibly compete with certain phosphorylation modifications and rapidly orchestrate protein activity due to its prompt and invertible addition and removal. Additionally, the sugar donor of O-glycosylation, i.e., Uridine Diphosphate-N-acetyl-glucosamine (UDP-GlcNAc), is the end-products of hexosamine biosynthesis pathway which integrates carbohydrate, amino acid, nucleotide and fatty acid metabolism. O-glycosylation, consequently, can function as a metabolic modulator and make transient regulation of protein function, localization and stability in response to fluctuations in nutrient intake.
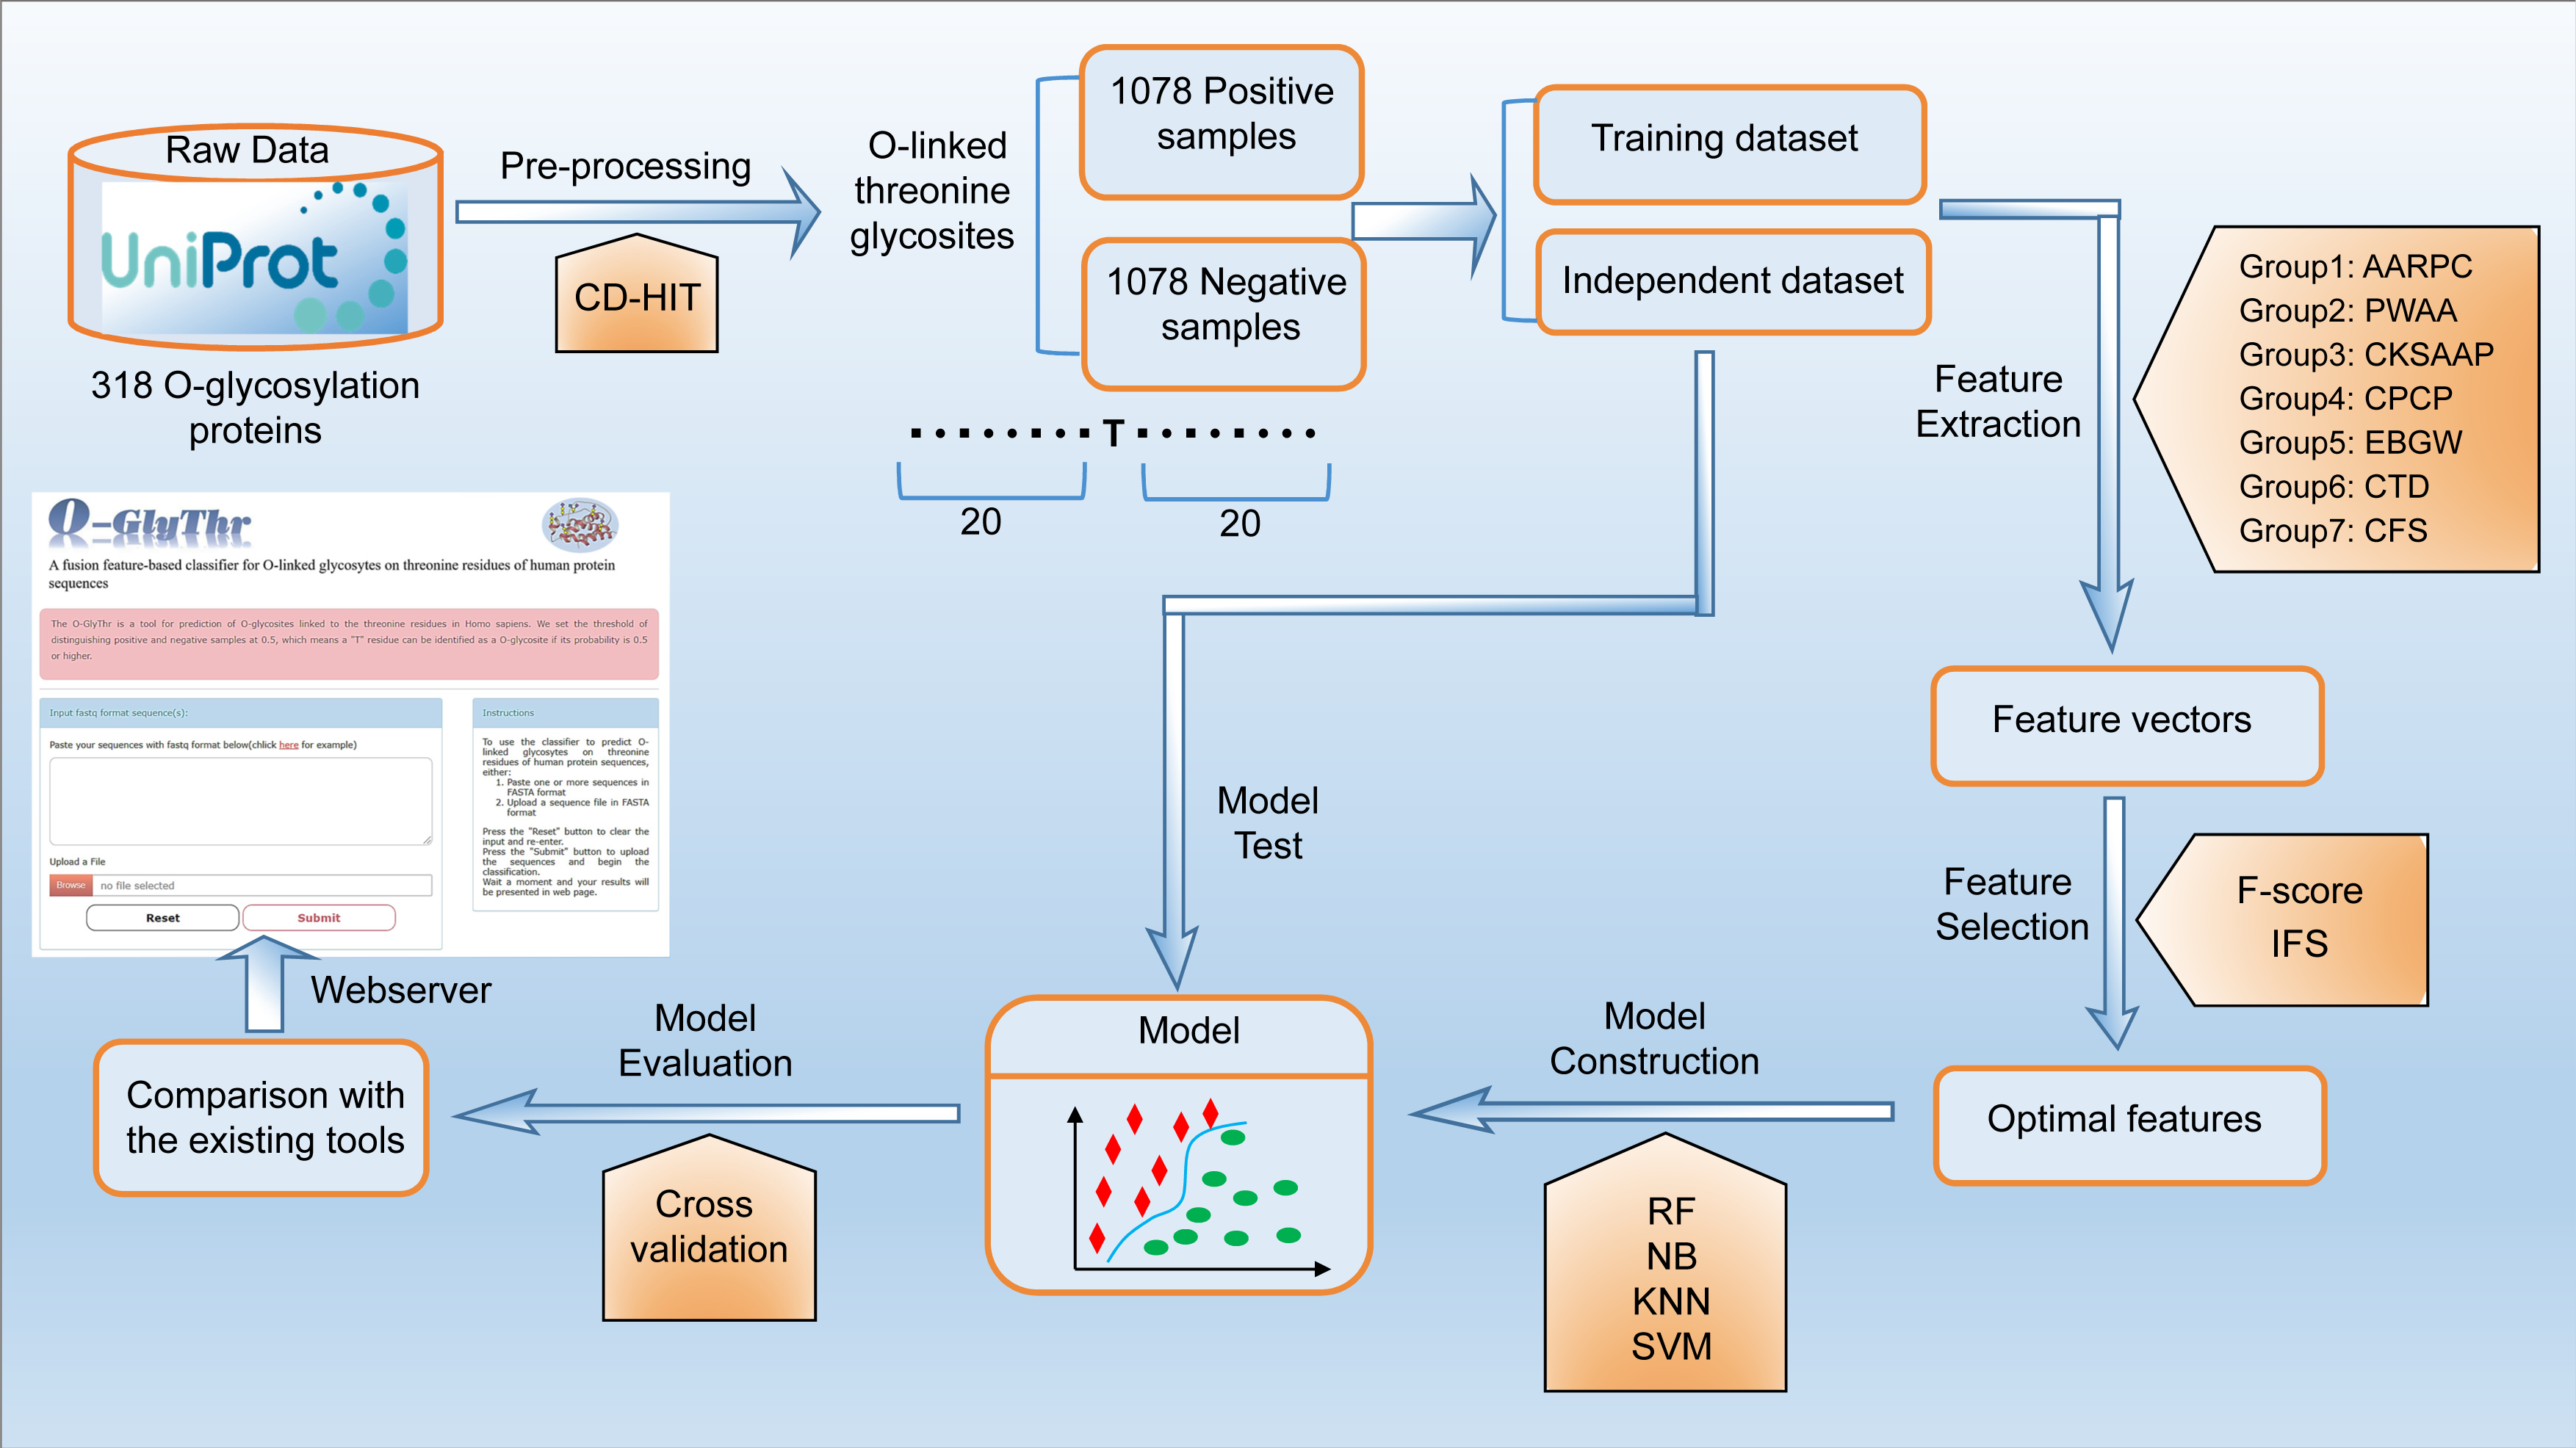
We spotlighted on the identification of O-linked threonine glycosites in human proteome. Initially, a strict and objective benchmark dataset was constructed for training and testing our proposed model. Seven groups of features were applied to depict peptide sequences in multiple views. F-score strategy combined with incremental feature selection (IFS) was performed to optimize the feature subsets. The random forest (RF) algorithm was employed to build a classifier for identifying potential O-glycosites. The 5-fold cross-validation (CV) test was used to determine the optimal model. And an independent dataset was applied to evaluate the model’s performance. Promising prediction accuracy demonstrated that the proposed model has relatively high capability for recognizing O-linked threonine glycosites in human.
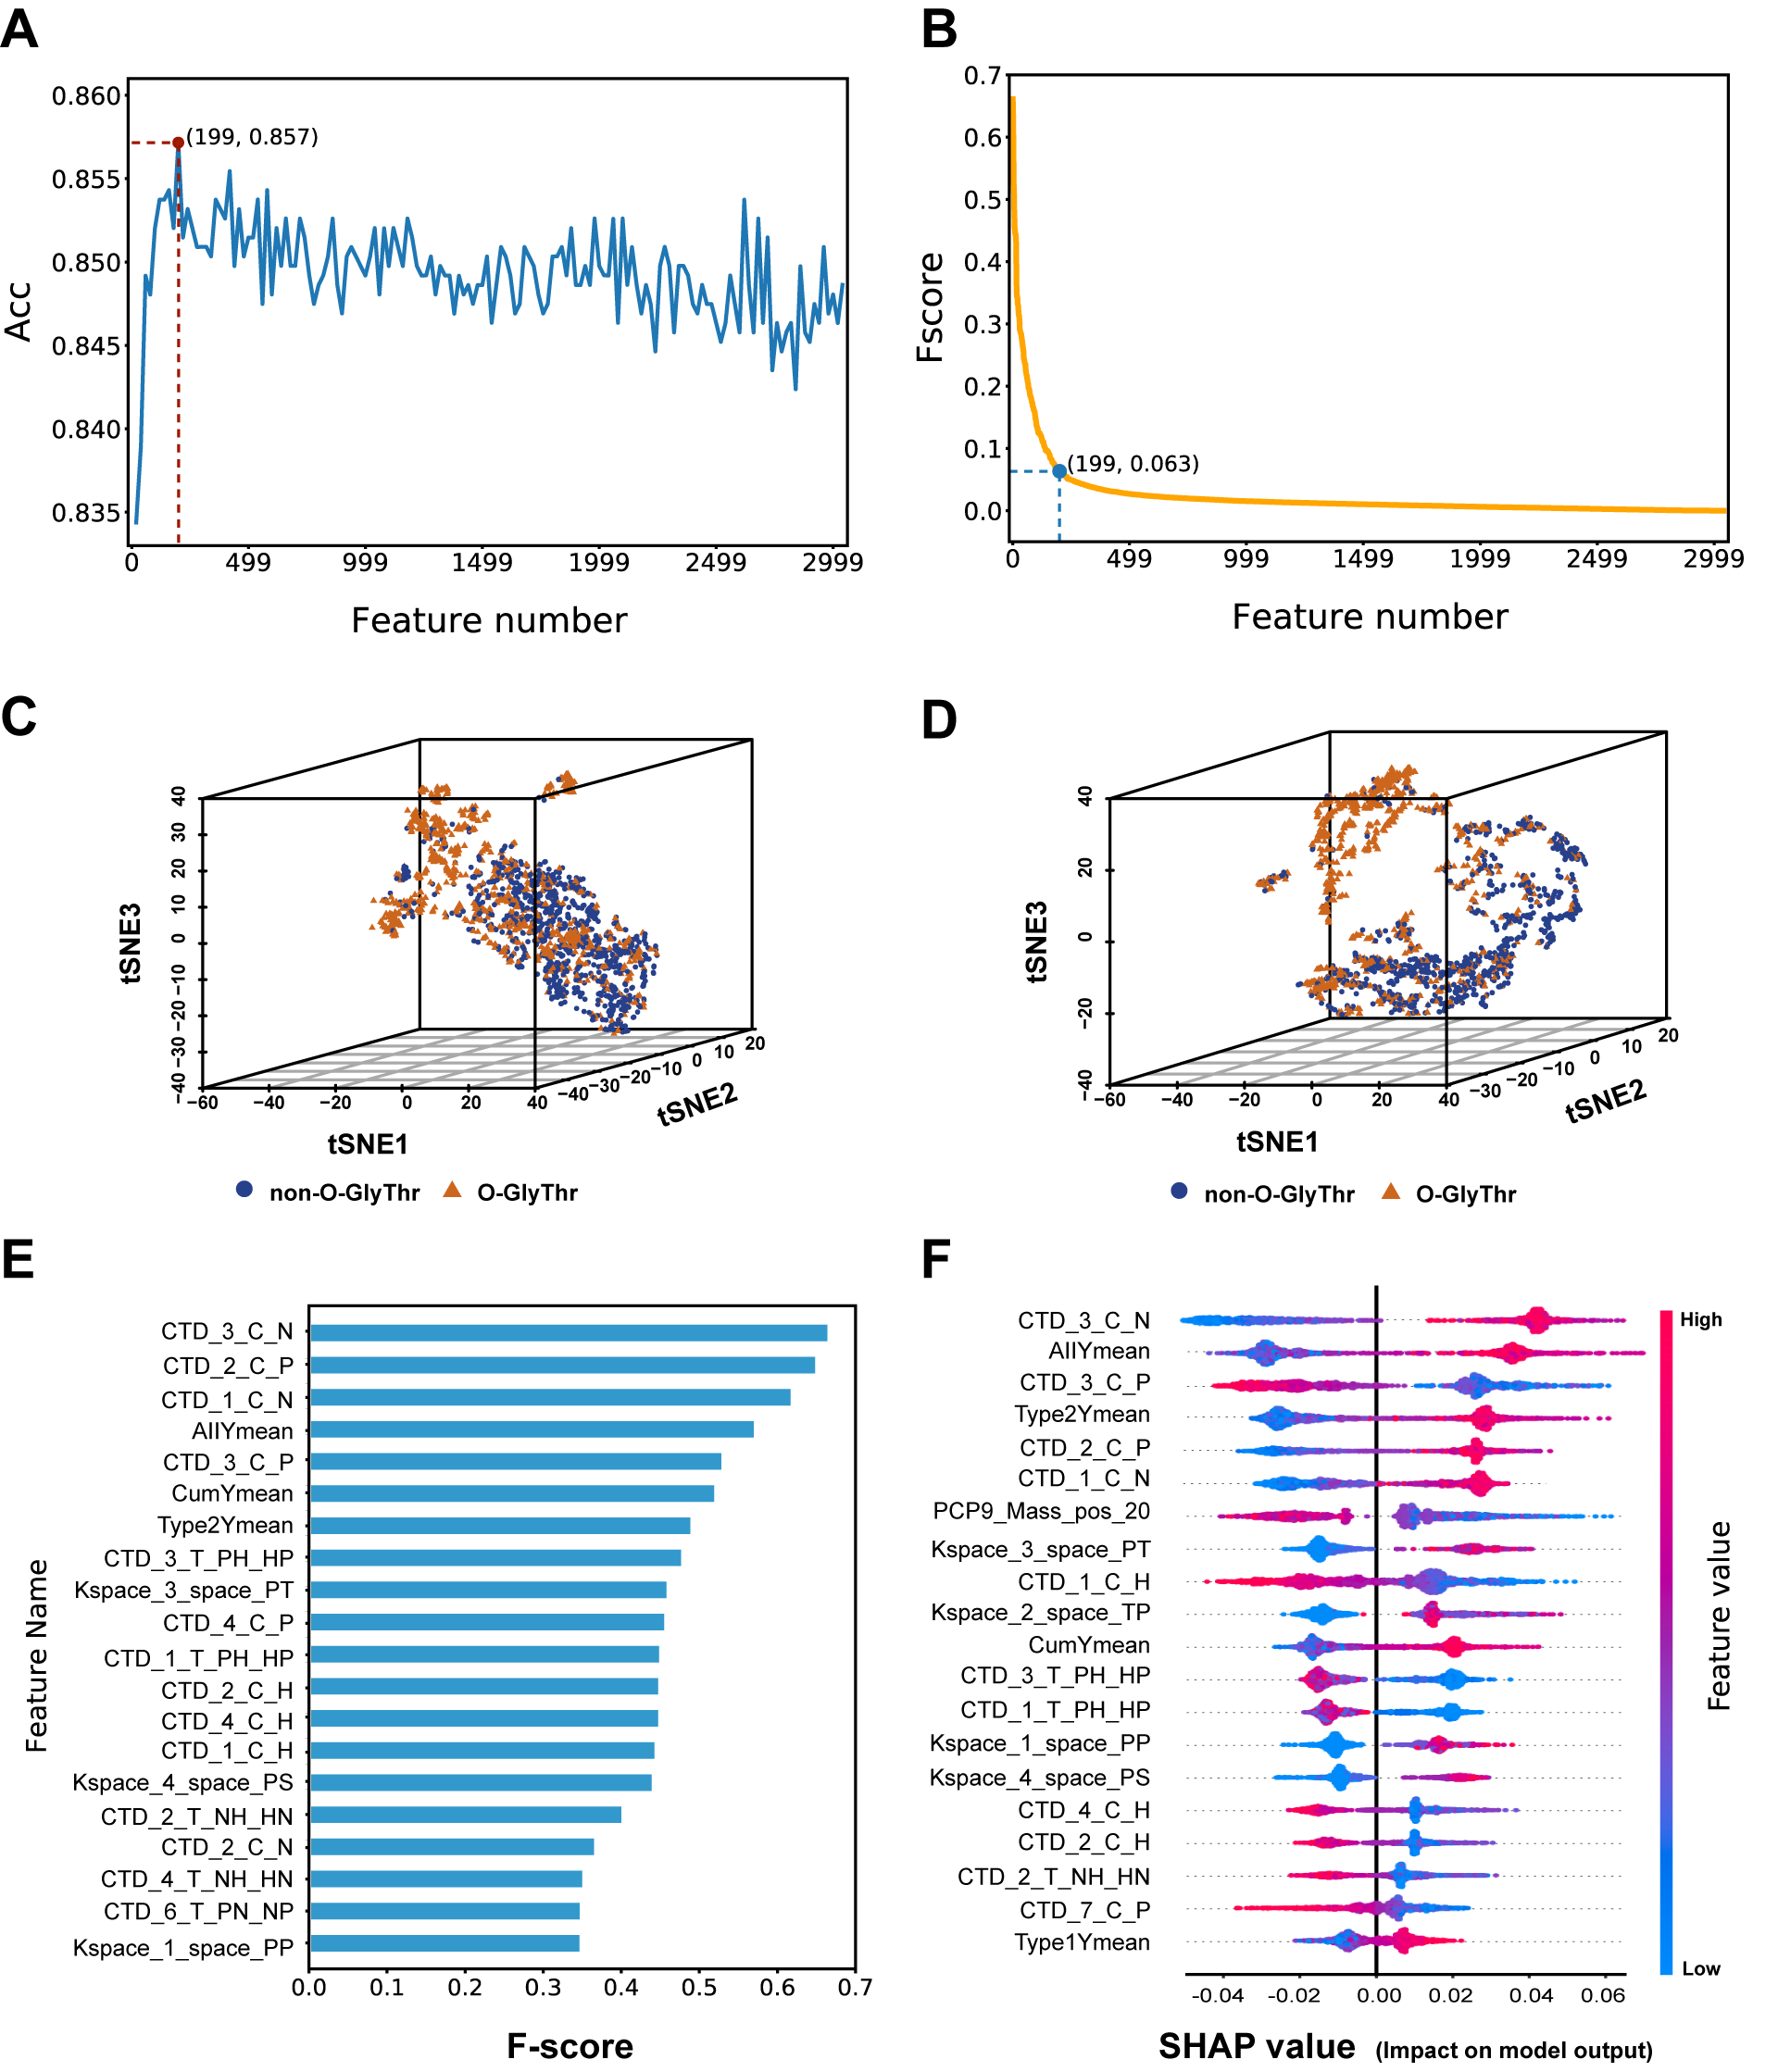
We applied F-score for ranking the features and performed IFS strategy with the four classifiers for screening the optimal feature subset. It was found that the RF model performed best when feature number increased to 199. T-SNE tool was applied to visualize the sample distribution in the feature space before and after feature optimization. Compared to the distribution chaos of positive and negative samples in the all-feature space, the positive samples were clustered clearly and significantly separated from the negative ones in the optimal-feature space even a few mixtures were still observed. Both Fscore and SHAP tools demonstrated that the top 20 features were from CTD, CFS and CKSAAP group of feature descriptors, indicating that the physicochemical properties of residues and short--range interaction between two residues contribute most to the training model.
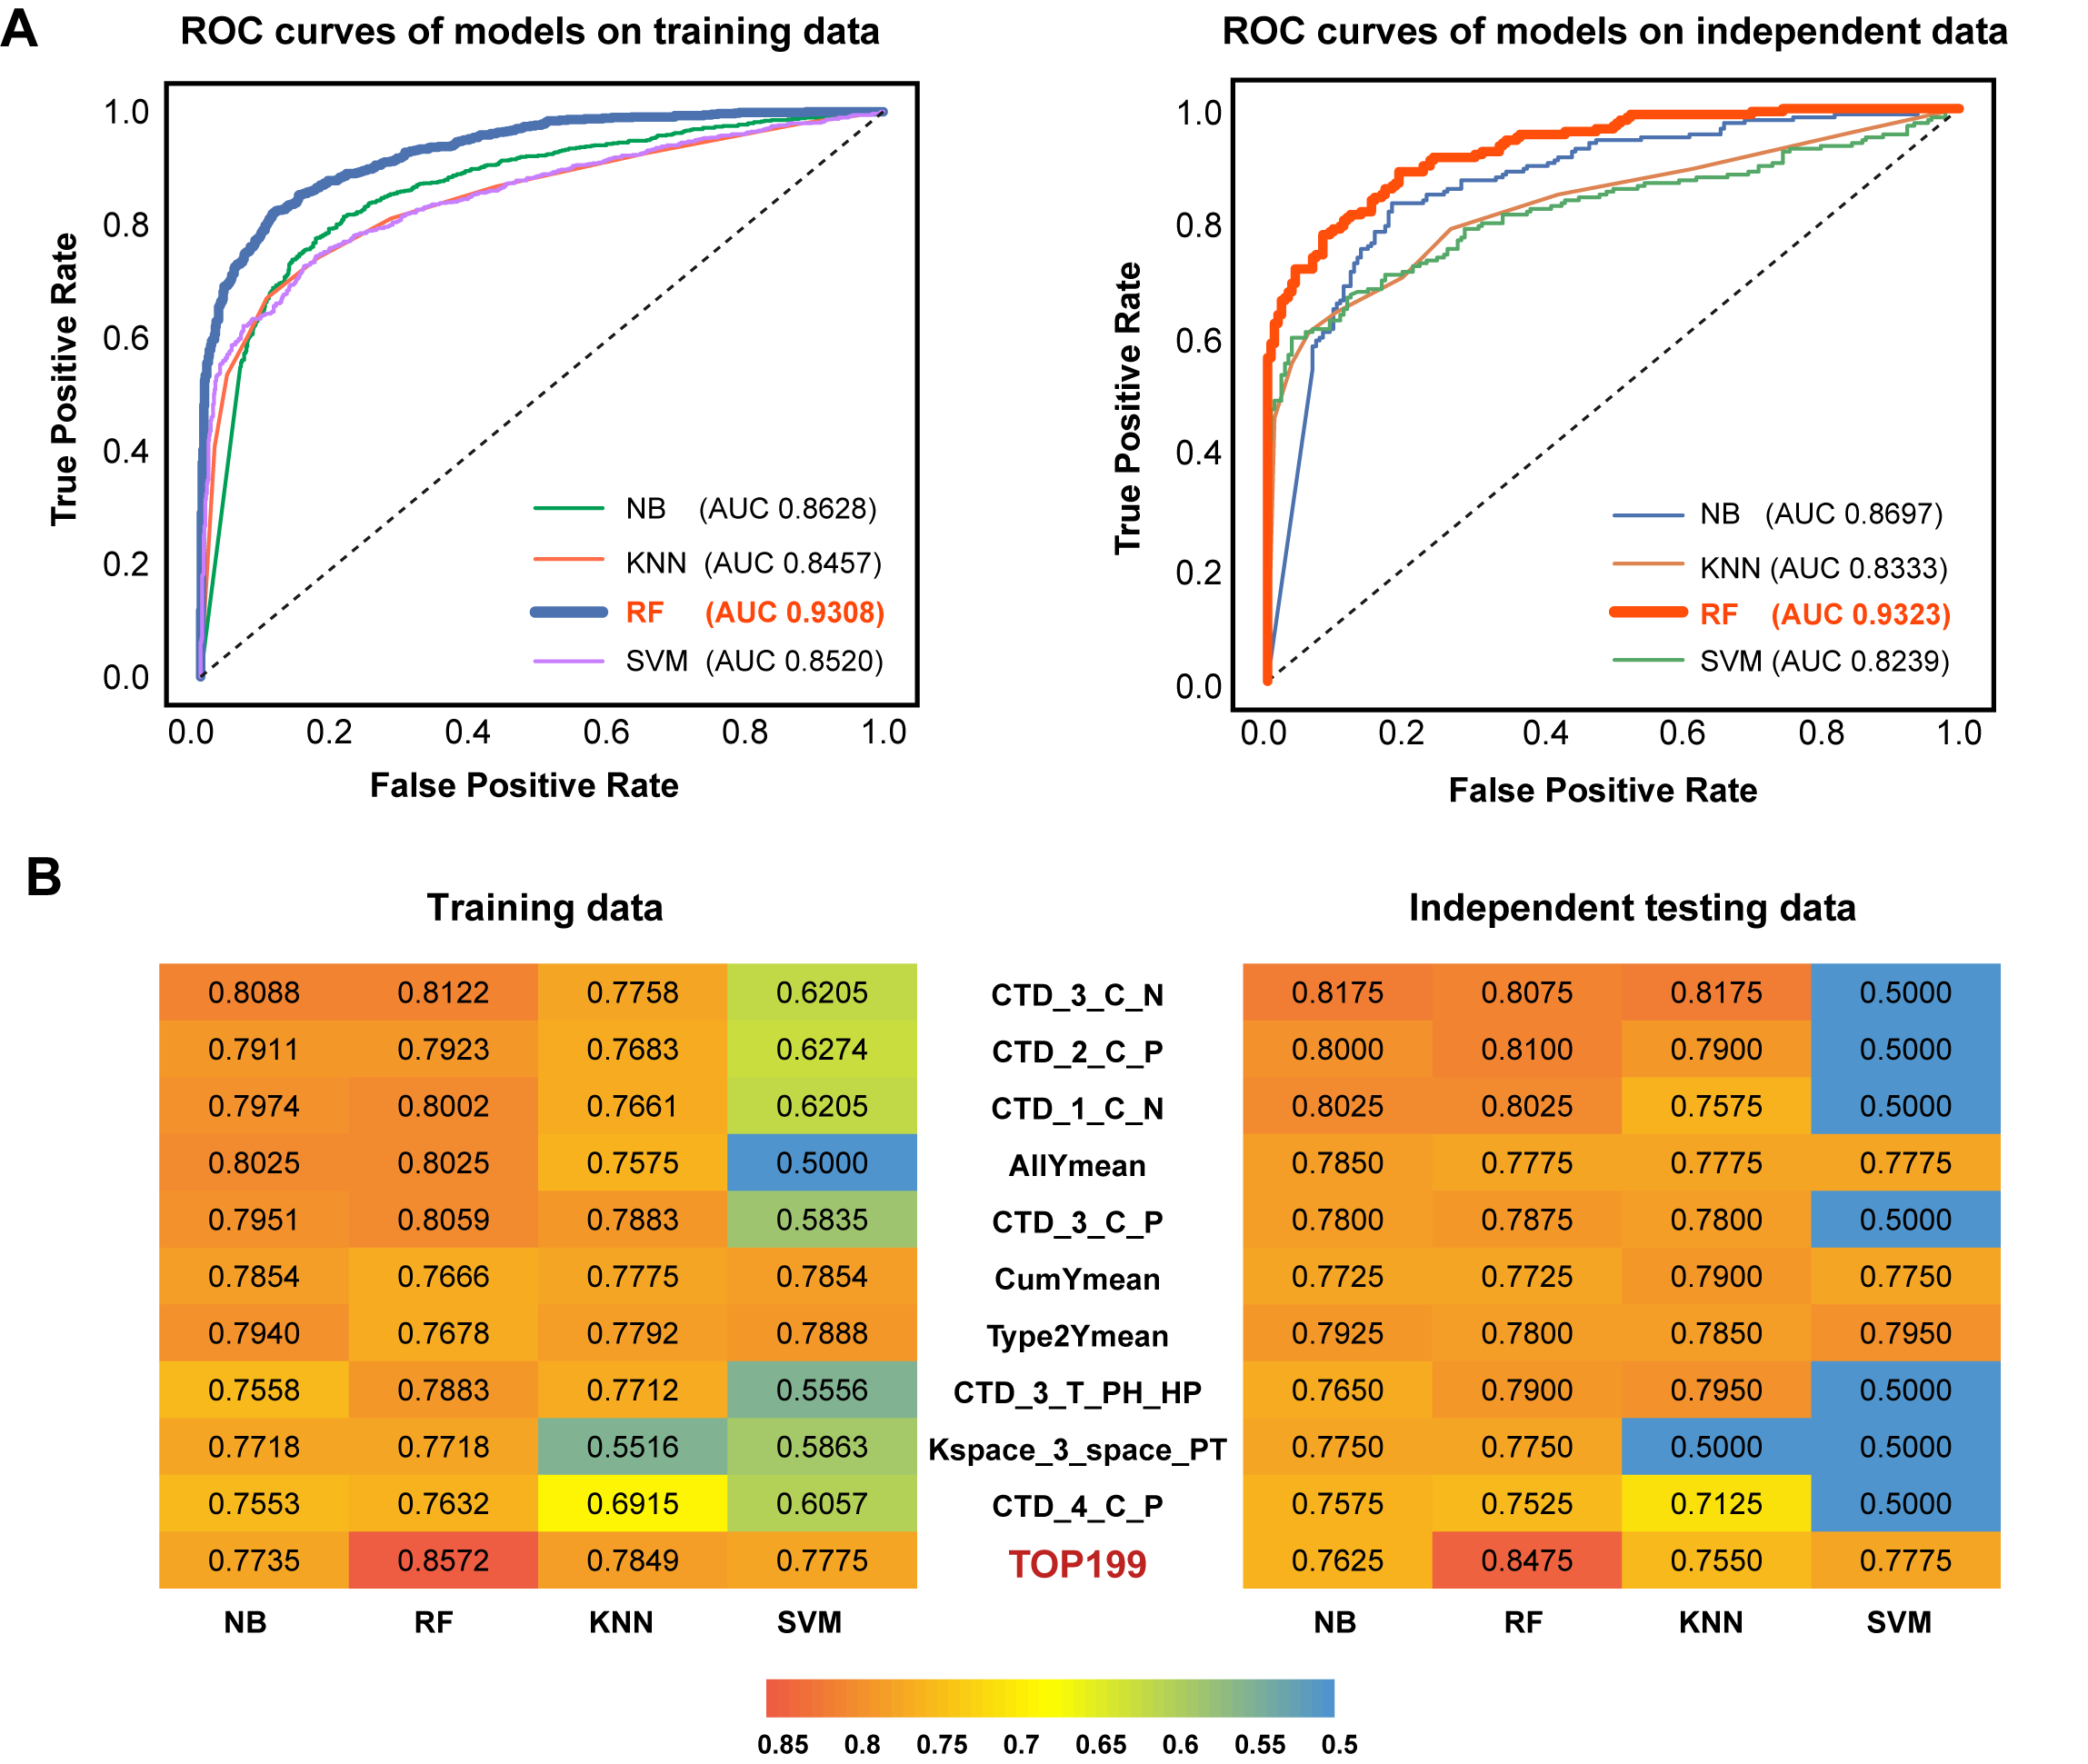
We rigorously evaluated the performance of four classifiers with the optimal feature subset based on 5-fold CV test on the training data as well as blind test on the independent data. The overall performance of the RF model surpassed the other three machine learning models both on the training data (ACC=0.8572, AUC=0.9308) and independent testing data (ACC=0.8475, AUC=0.9323).
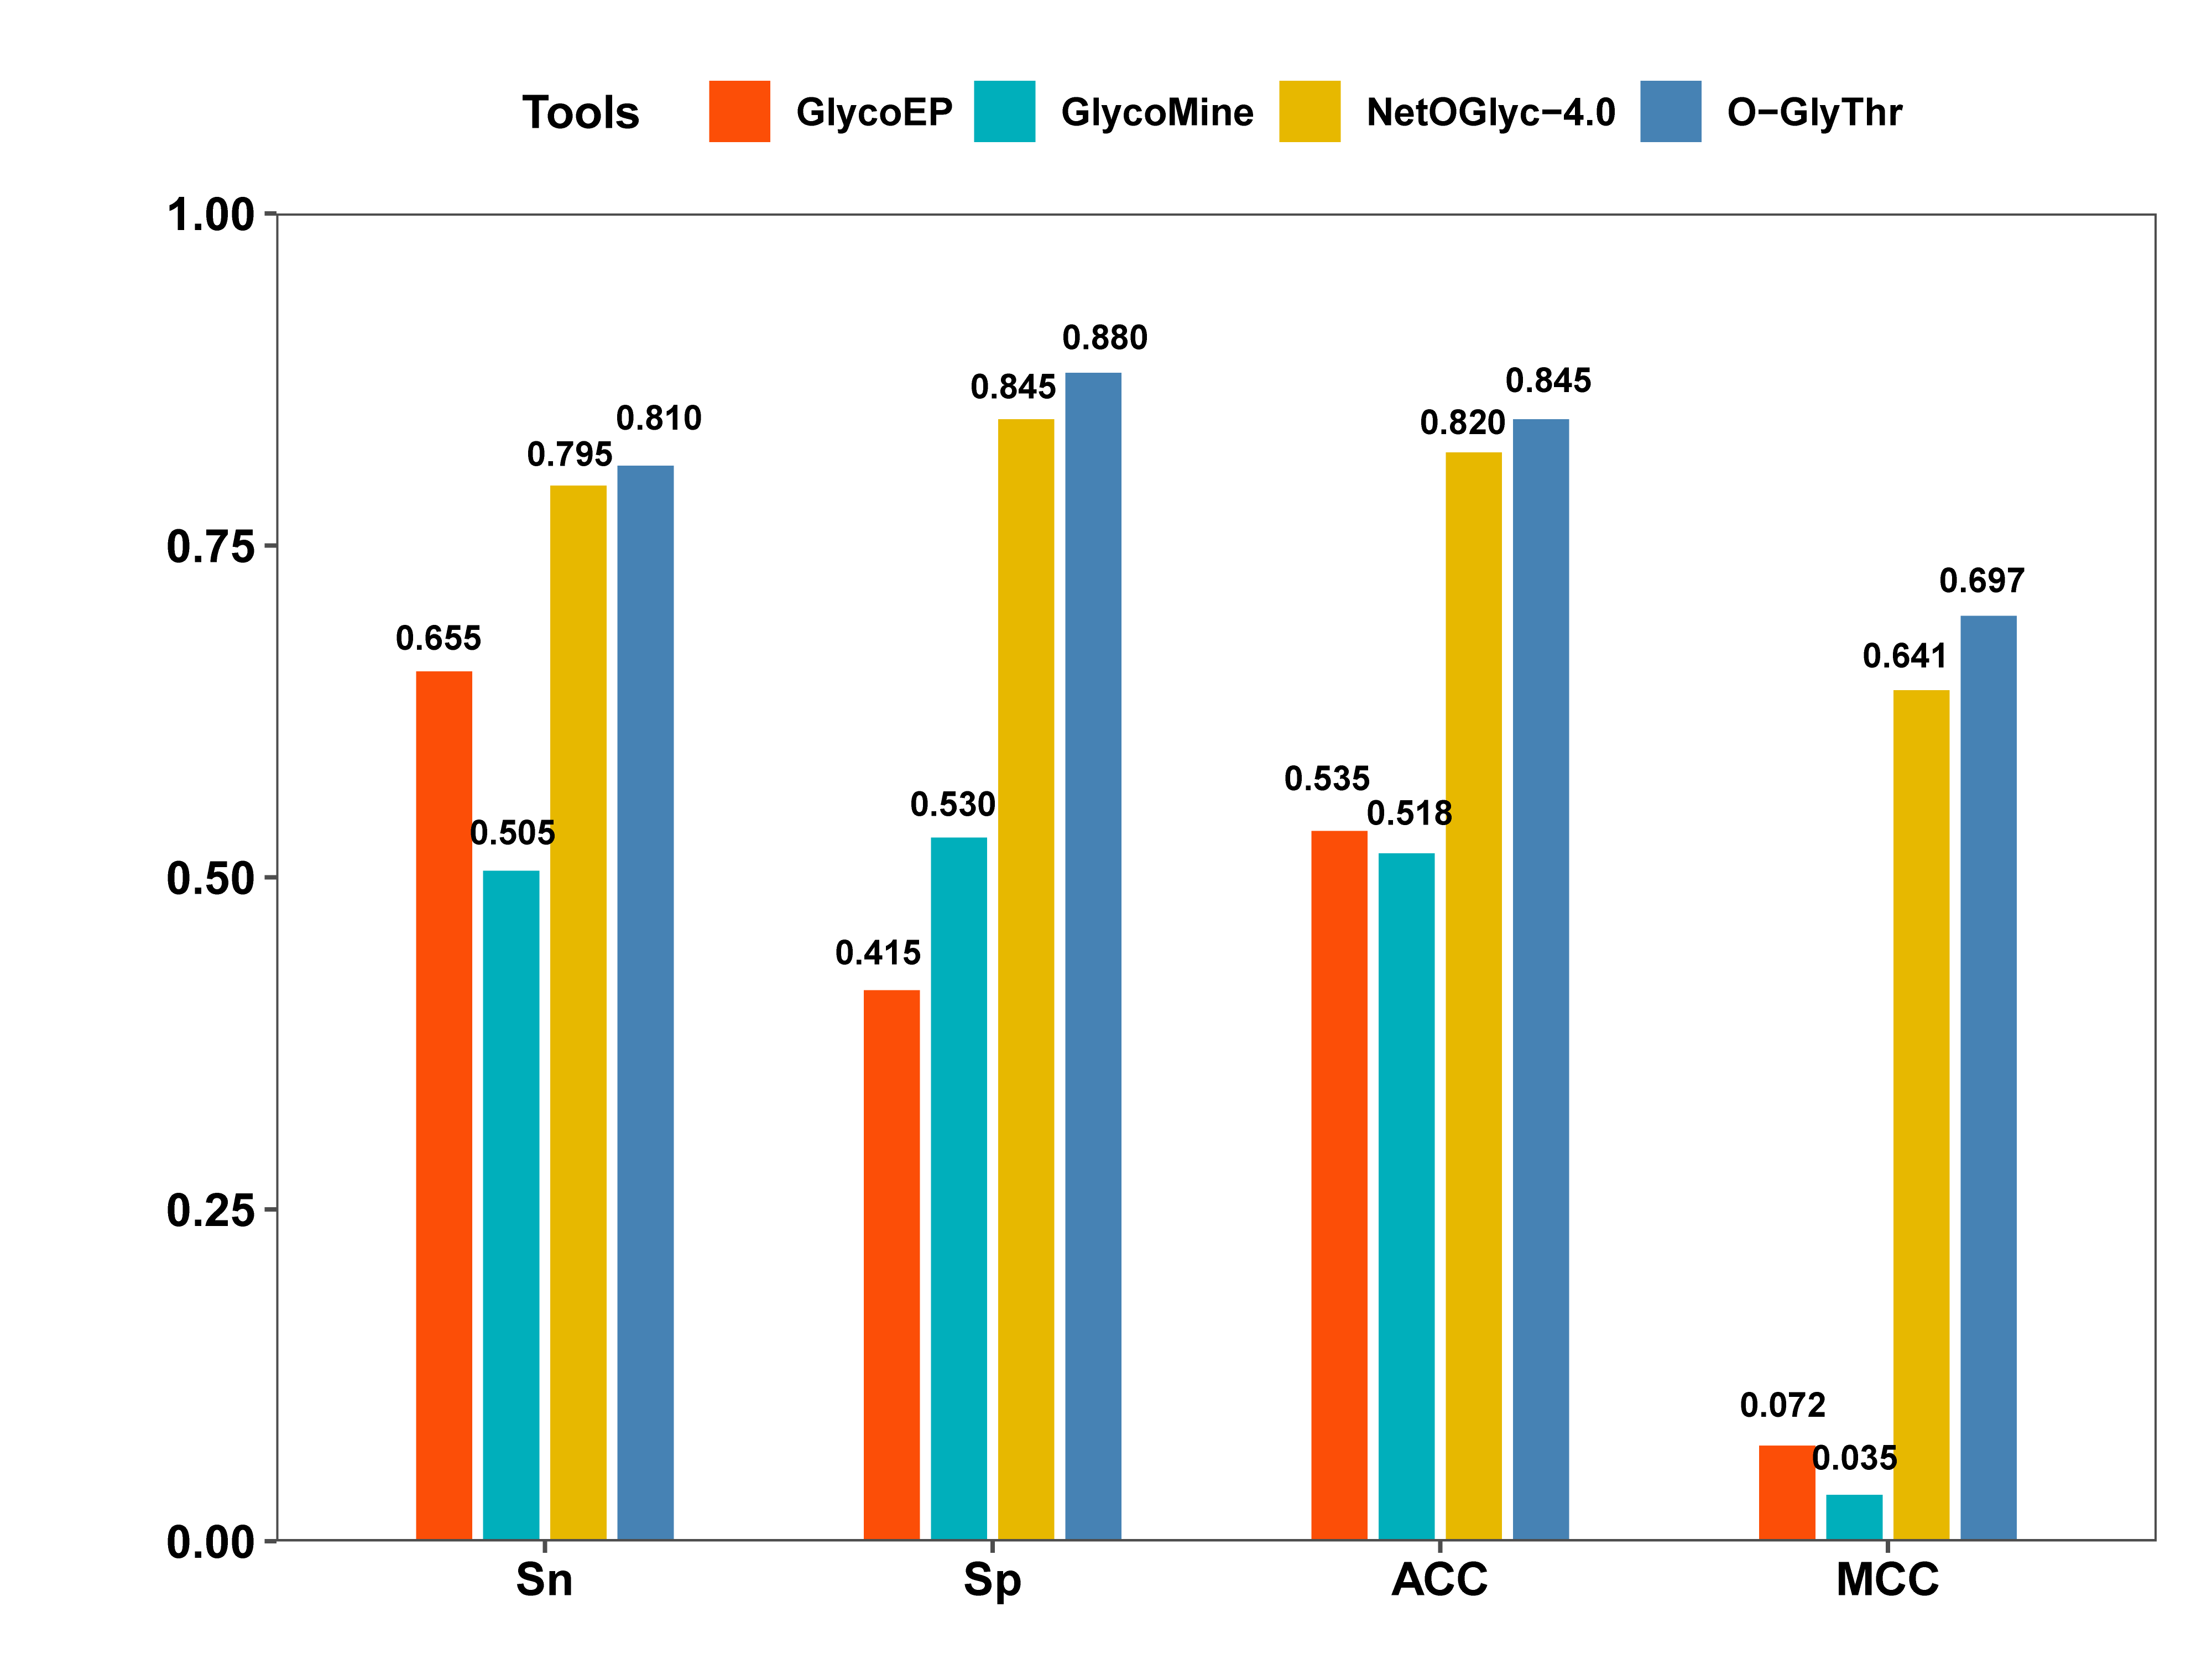
We used an independent testing dataset, completely independent of the training data of the four predictors, to compare the prediction performances of O-GlyThr with other existing available online predictors. O-GlyThr outperformed any of the other three tools, demonstrating its superiority for the identification of O-linked threonine glycosites. GlycoEP could recognize relatively larger number of true O-glycosites (Sn=0.6550). But meanwhile, it also obtained the highest false positive rate (Sp=0.4150). The performances of GlycoMine were similarly unsatisfactory. NetOGlyc-4.0 could well balance the prediction rate of false positive and true positive, generating a ACC of 0.8200, but still 2.5% lower than our model.