Cite Us:
Asteraceae Genome Database (AGD): A comprehensive platform for Asteraceae genomics
Help
Welcome to AGD (Asteraceae Genome Ddatabase),
an integrative database for Asteraceae genome. In AGD users can:
- Browse information about plant, genome,
- Search plant, genome, or keywords related to gene
annotation.
- Analyze by BLAST, JBrowse, SSR Finder, HmmSearch, Heatmap,
Primer3, plantiSMASH, and CRISPRCasFinder.
In order to make sure AGD is convenient to be used, the help page is prepared.
1 Browse
- Browse information about plant, genome,
- Search plant, genome, or keywords related to gene annotation.
- Analyze by BLAST, JBrowse, SSR Finder, HmmSearch, Heatmap, Primer3, plantiSMASH, and CRISPRCasFinder.
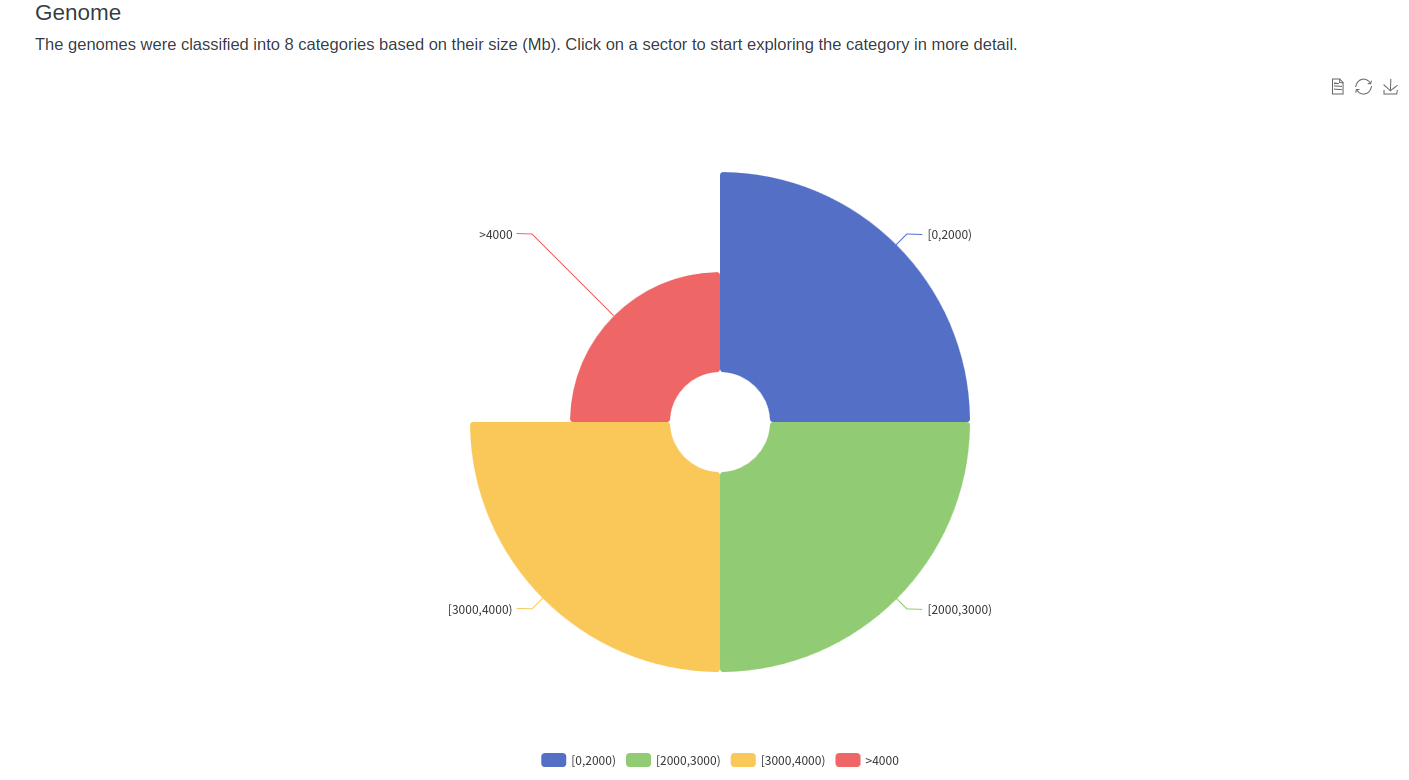
At present,14 kinds of plants, 7 corresponding genomes(different parts from the same plant), together with the related information on plant species, genomes were included in AGD.
1-1 Full list
Users can quickly view the list of all plants, genomes in AGD through the "Browse" button on the toolbar.
1-2 Details page
The detailed information about each plant, genome was displayed in three types of report pages. Users can visit relevant pages through internal links in the full list page or search results page.Species distribution maps from the website of GBIF - Global Biodiversity Information Facility https://www.gbif.org/
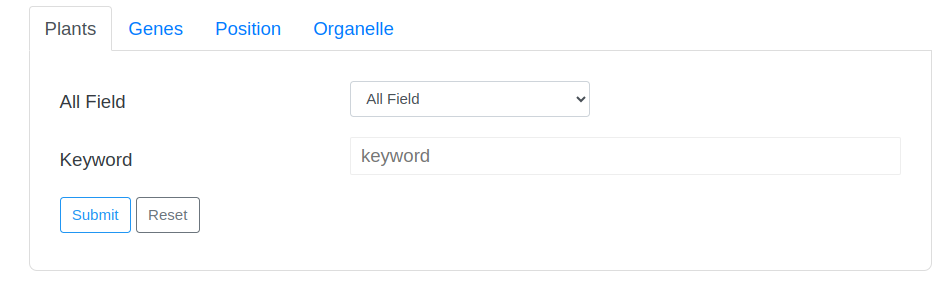
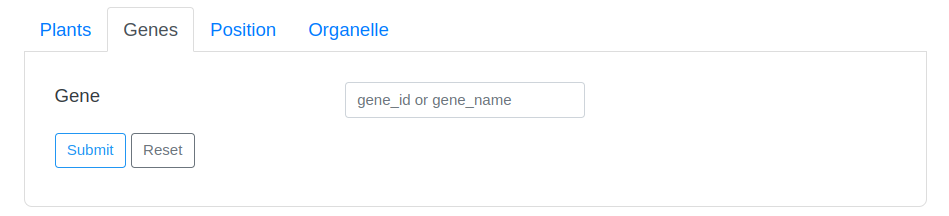
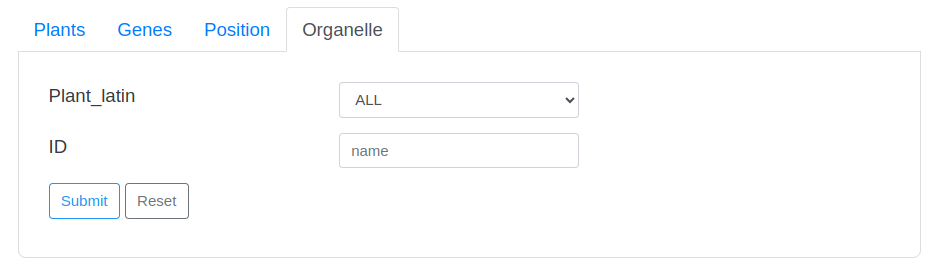
2 Search
Users can input AGD ID, Latin name, gene ID, Pfam, SMART, PANTHER, or functional annotation keywords in the search bar for quick search.
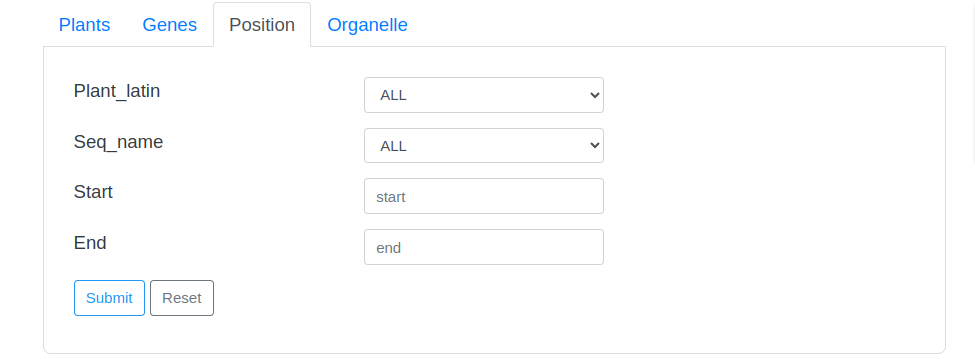
2-1 Search Tips
The search page provides two drop-down options and an input box. The first drop-down option contains the Latin names of all species in the database. Users can directly select the species they want to view and click the search button to search. The second drop-down option is the search field, users can select a field, and then enter a keyword in the third input box to perform the search.
Some search examples are provided on the right side of the page, and the word cloud on the page can also be clicked to view.
2-2 Search Result
Search results will be redirected to the detail page of the corresponding entry.
3 Tools
AGD embedded nine analysis tools, including BLAST, JBrowse, SSR Finder, Synteny Viewer, HmmSearch, Heatmap, Primer3, PlantiSMASH, and CRISPRCasFinder.
3-1 BLAST
The BLAST was based on the SequenceServer application, where users can search the list of genes of interest.
Learn more about
BLAST
NCBI BLAST
Home page
3-1-1 Perform
The following shows the interface to run BLAST, users only need four steps to perform a BLAST search.
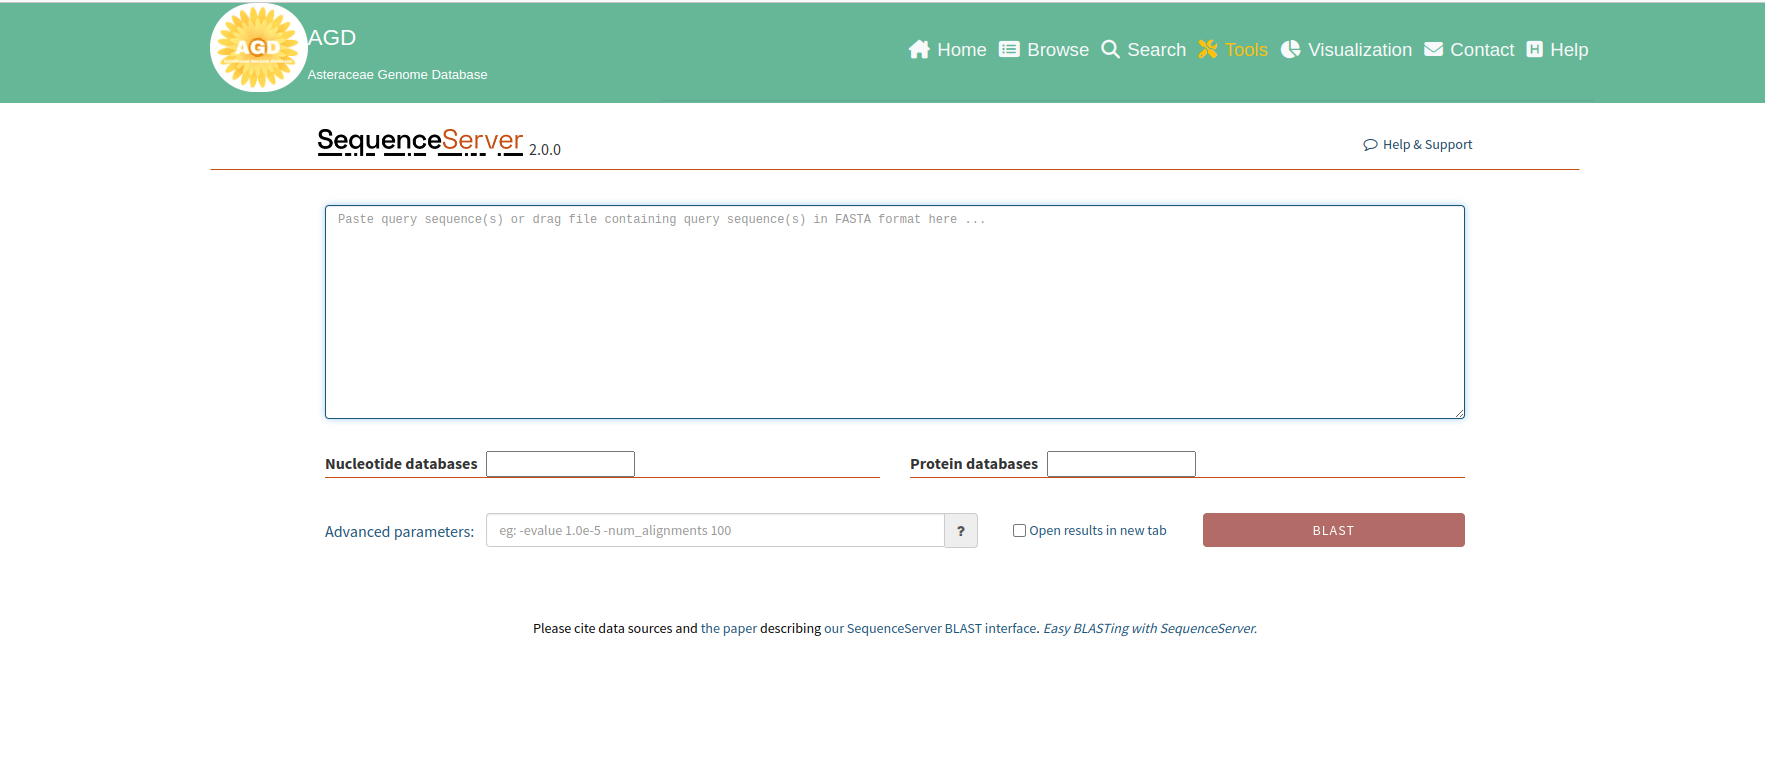
Step 1. Upload the query sequences
To perform a sequence search, users can paste their sequences in the query region or
drag a sequence file (<10Mb)
to the query region. The sequence type (protein/nucleotides) can be automatically
detected.
Note: Original sequences or multiple fasta formats are supported when pasting
from the clipboard,
but sequences uploaded from a file can only be in fasta format. Learn more about
fasta format
here.
Step 2. Select databases
After uploading query sequences, users can select one or more databases to
search.
Note: Only one type of database (Nucleotide or Protein) can be selected.
Step 3. Select parameters
The "Advanced parameters" input box allows users to run BLAST with their custom
parameters. Users could
click on the “?” button to view the available parameters. If users leave the box
empty, the default parameters will be used.
Learn more about BLAST parameters here.
Step 4. Perform BLAST
After completing the previous steps, the BLAST button will automatically change to
the corresponding BLAST subroutine
(BLASTn, BLASTx, BLASTp, etc.) depending on the query sequence and the type of
database. Click on the BLAST button to perform the
analysis, and users will see a status page like this:

After the BLAST is done, it will automatically lead users to the result page.
3-1-2 Result
Below is an example of the BLAST result page, the result page can be generally divided into 5 sections:
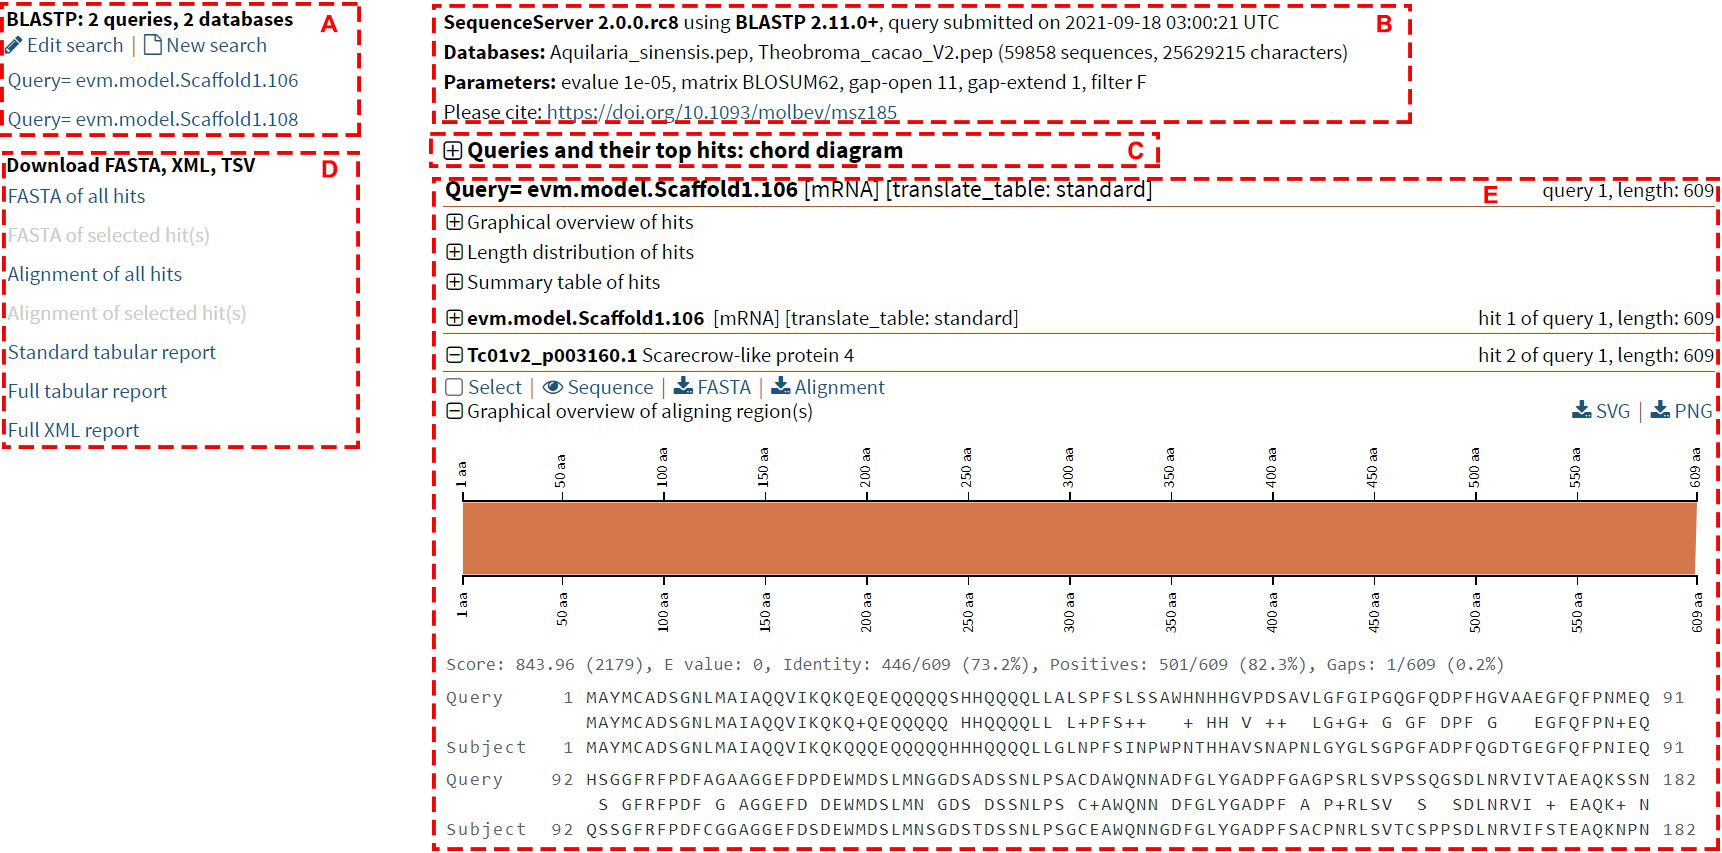
Section A: Category of query sequences
This section indicates the result of each sequence of the query sequence.
Clicking on the query sequence ID will lead users to the details of the query
sequence.
Section B: General information
This section contains the general information of the mission, including the version
of the program, the
submitting time, the database information, and the parameters used.
Section C: Queries and their top hits: chord diagram
This section is a chord diagram that represents the mapping information between the
query sequence and
similar sequences in the database. Hovering over the ribbon will display the
identity and E-value of this alignment.

Section D: Download Category
This section allows users to download all or the selected results in different
formats to their local machine.
Section E: BLAST hits information
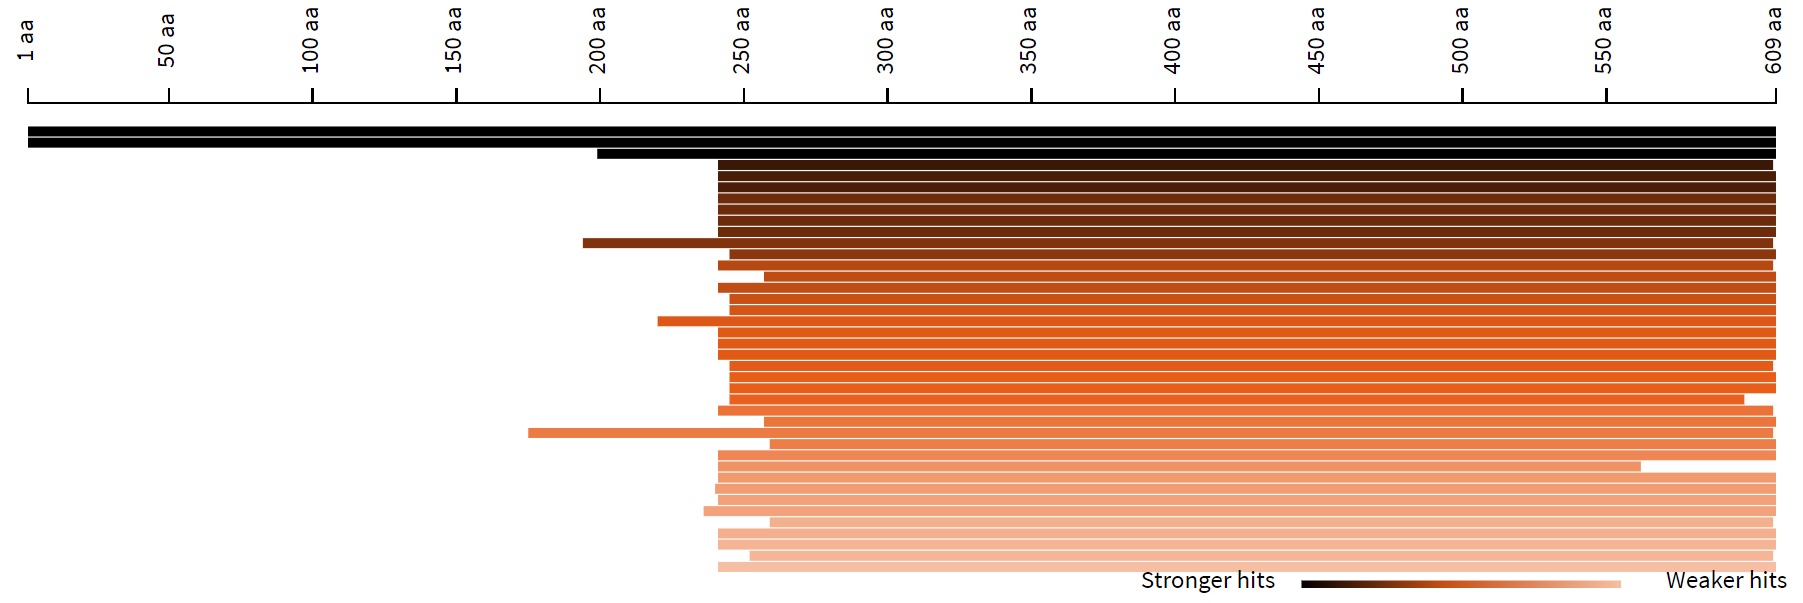
1. Graphical overview of hits
This part shows the BLAST hits for each query sequence. Each bar represents a hit in
the database,
and the color of the bar deepens when the hit is stronger. Hovering over the bar
displays the sequence
ID and E-value for the hit, and clicking on the bar displays detailed alignment
information for the hit.
2. Length distribution of hits
This is a histogram of the length of similar sequences in the database. Hovering
over the histogram will
display the ID, E-value, and length of the sequence.

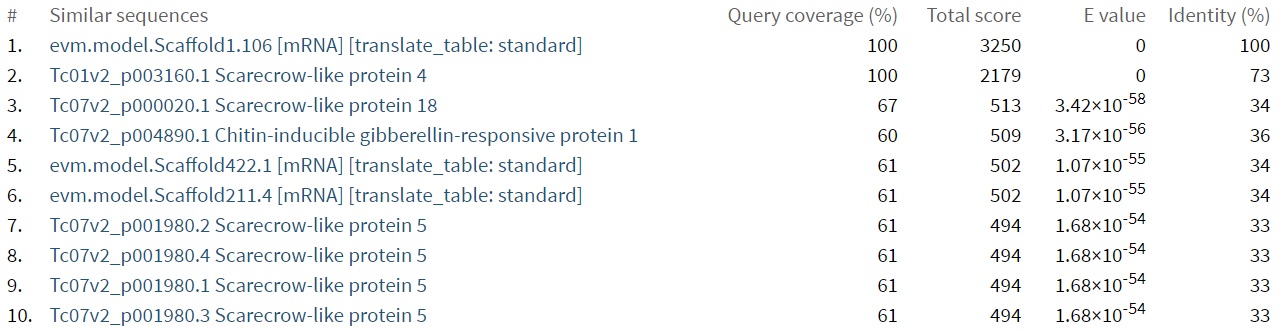
3. Summary table of hits
This is a list view of BLAST hit results, including sequence name, query coverage,
total score, E-value,
and identity. Clicking on a sequence name will lead you to a detailed alignment of
that hit.
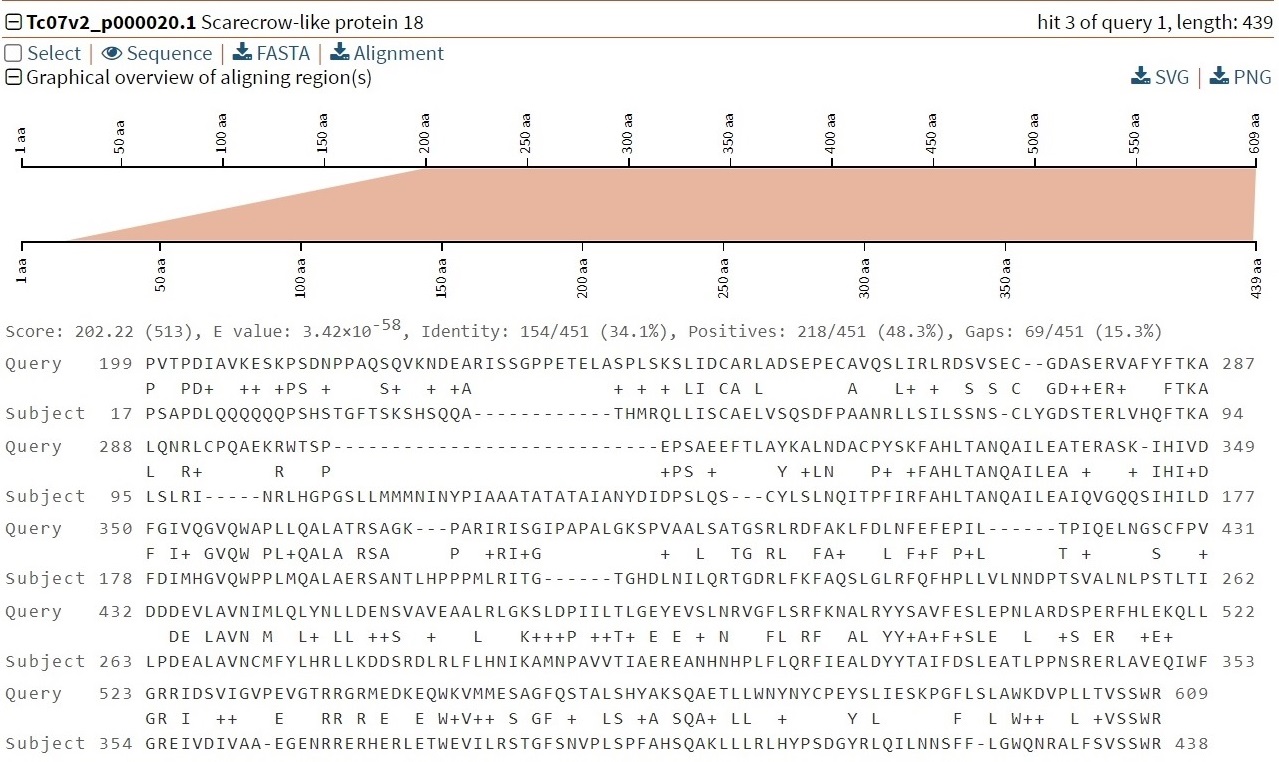
4. Details of each hit
Check the "Select" box so that users can download only the results of the selected
records in Section D.
Clicking on "Sequence" will display the detailed sequence. Clicking on "FASTA" and
"Alignment" will download
the results for fasta format sequence and the alignment result, respectively. At the
bottom is an
overview of the graphs and alignments for this hit.
3-2 JBrowse
AGD provides JBrowse to visualize genomic data, and there are many tutorials online on how to use JBrowse, such as JBrowse Documentation. We have provided two tracks (reference sequence and genome annotation) in JBrowse.
3-3 SSR Finder
The SSR Finder page has two parts, the first part is the Web SSR Finder, which identifies SSRs based on the sequences provided by the users, and the second part is all SSRs identified in the CDS and whole genome sequences of all genomes in this database.
3-3-1 Perform
The following shows the interface to run SSR Finder, users only need three steps to perform an SSR search.

Step 1. Upload the query sequences
To perform the SSR Finder, users need to click on the "Choose File" button and then
upload a sequence file (<10Mb).
Note:Sequences file can only be in fasta format. Learn more about fasta
format
here.
Step 2. Change parameters
After uploading sequences, users can change one or more parameters to search.
Step 3. Perform SSR Finder
When the above steps are completed, users can click the "start" button to start an
analysis.
After the analysis is done, it will lead users to the result page automatically.
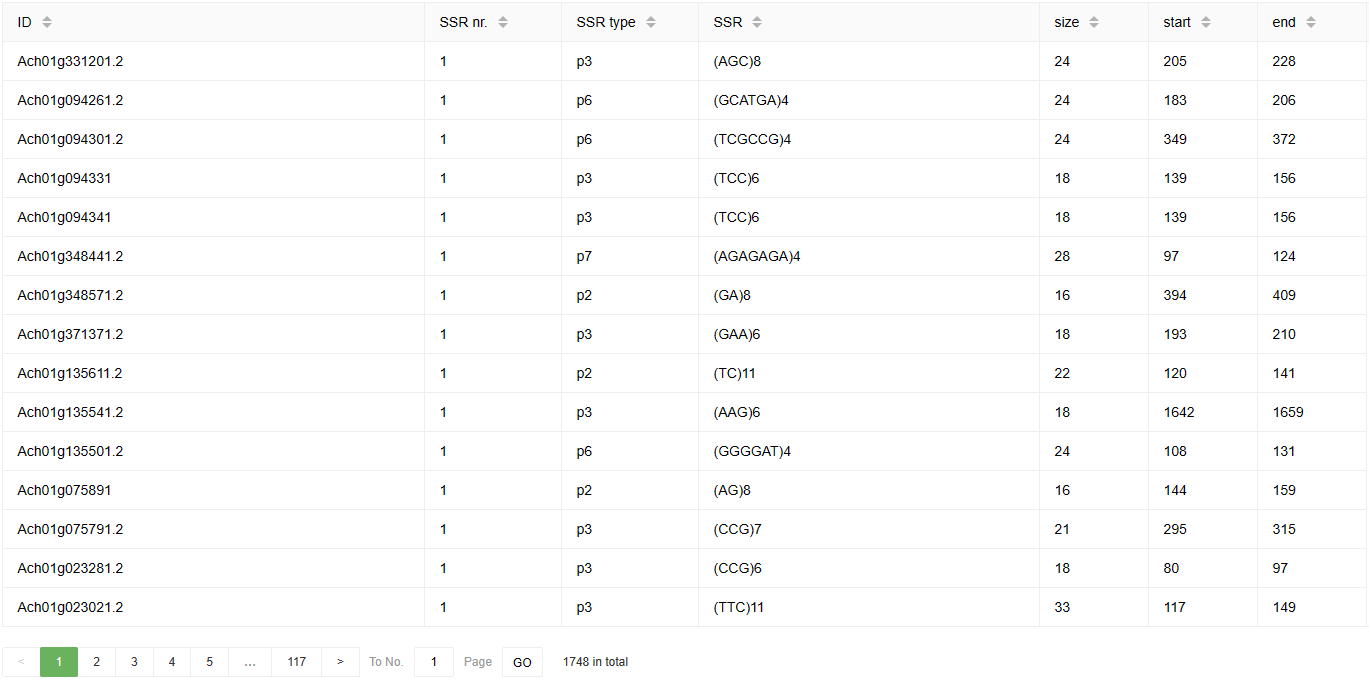
3-3-2 Result
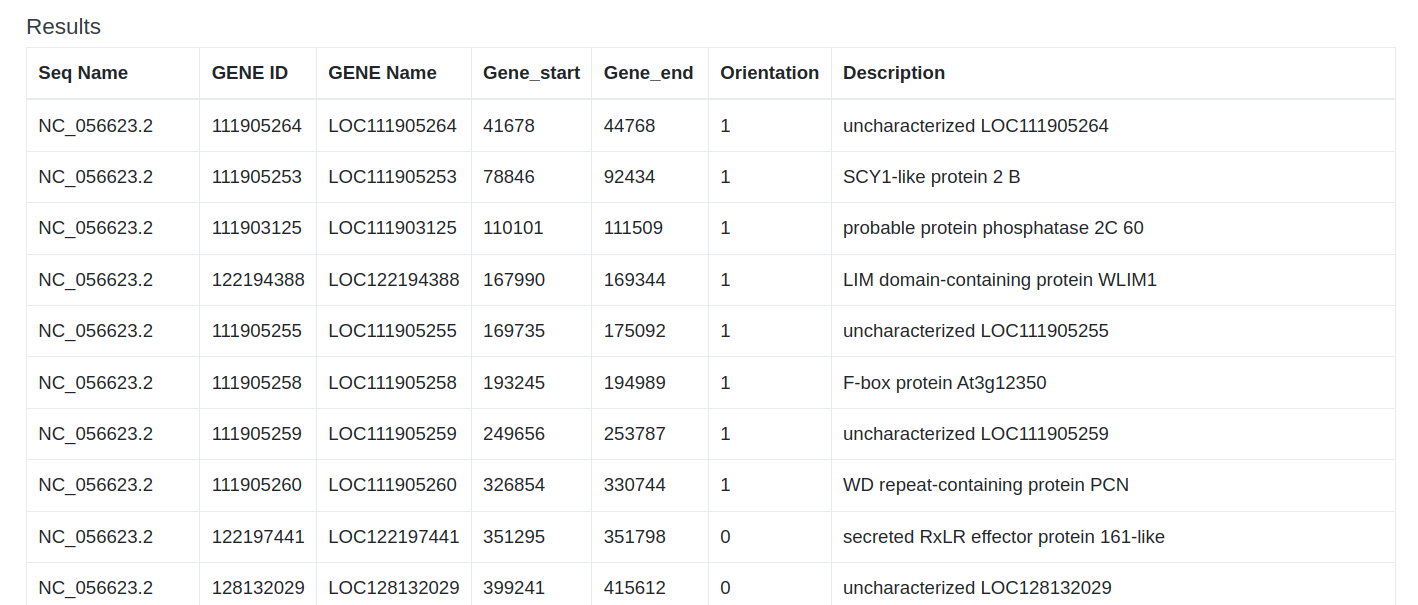
Below is an example of the SSR Finder result page. The results include the number, type, sequences, size, and start and end positions of the SSRs in the query sequence.
3-4 HmmSearch
AGD provides HmmSearch to identify protein domain.
3-4-1 Perform
The following shows the interface to run HmmSearch, users only need four steps to perform an HmmSearch.
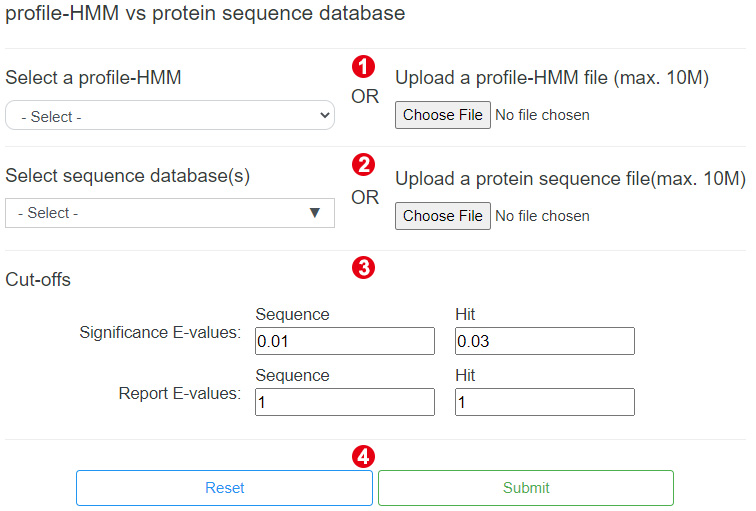
Step 1. Select or upload a profile-HMM
To perform the HmmSearch, users need to select a profile-HMM name from the drop down
box or click on the "Choose File" button to upload a profile-HMM file (<10Mb).
Note:The profile-HMM file can only be in HMMER3 format. Learn more about
HMMER3 format
here.
Step 2. Select or upload a sequence database
After selecting or uploading the profile-HMM, users need to select or upload a
sequence database.
Note:The sequences file can only be protein sequence in fasta format. Learn
more about fasta format
here.
Step 3. Set cut-offs
Users can change the reporting and inclusion thresholds to control which hits are
reported in the results.
Step 4. Perform HmmSearch
When the above steps are completed, users can click the "Submit" button to start an
analysis.
After the analysis is done, it will lead users to the result page automatically.
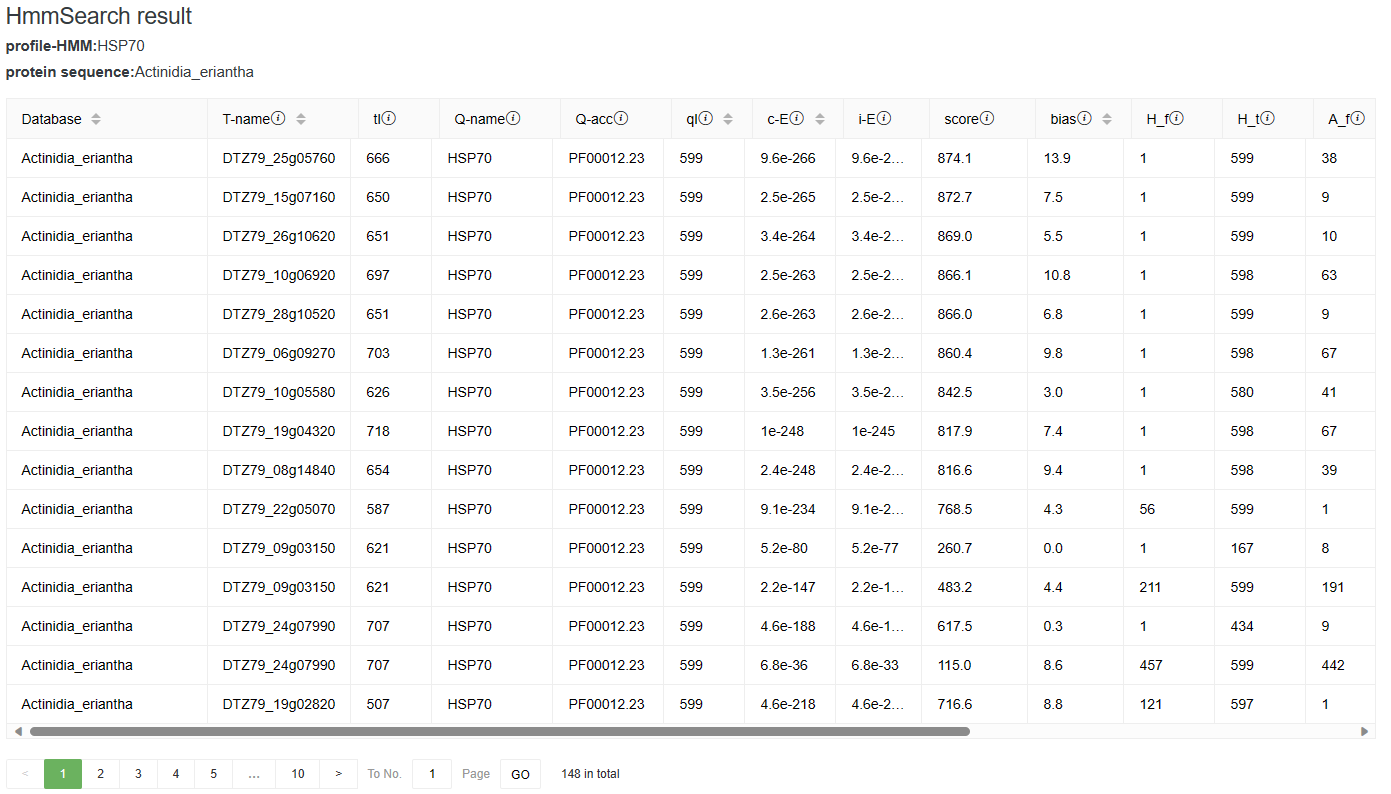
3-4-2 Result
In the results, we show the domain hits table. There is one line for each domain. There may be more than one domain per sequence. The domain table has 18 fields followed by a text target sequence description. Users can mouse over the information icon on the right side of the field to view the full field description.
3-5 Heatmap
AGD provides Heatmap to create heatmap.
3-5-1 Perform
The following shows the interface to run Heatmap, users only need three steps to perform Heatmap.
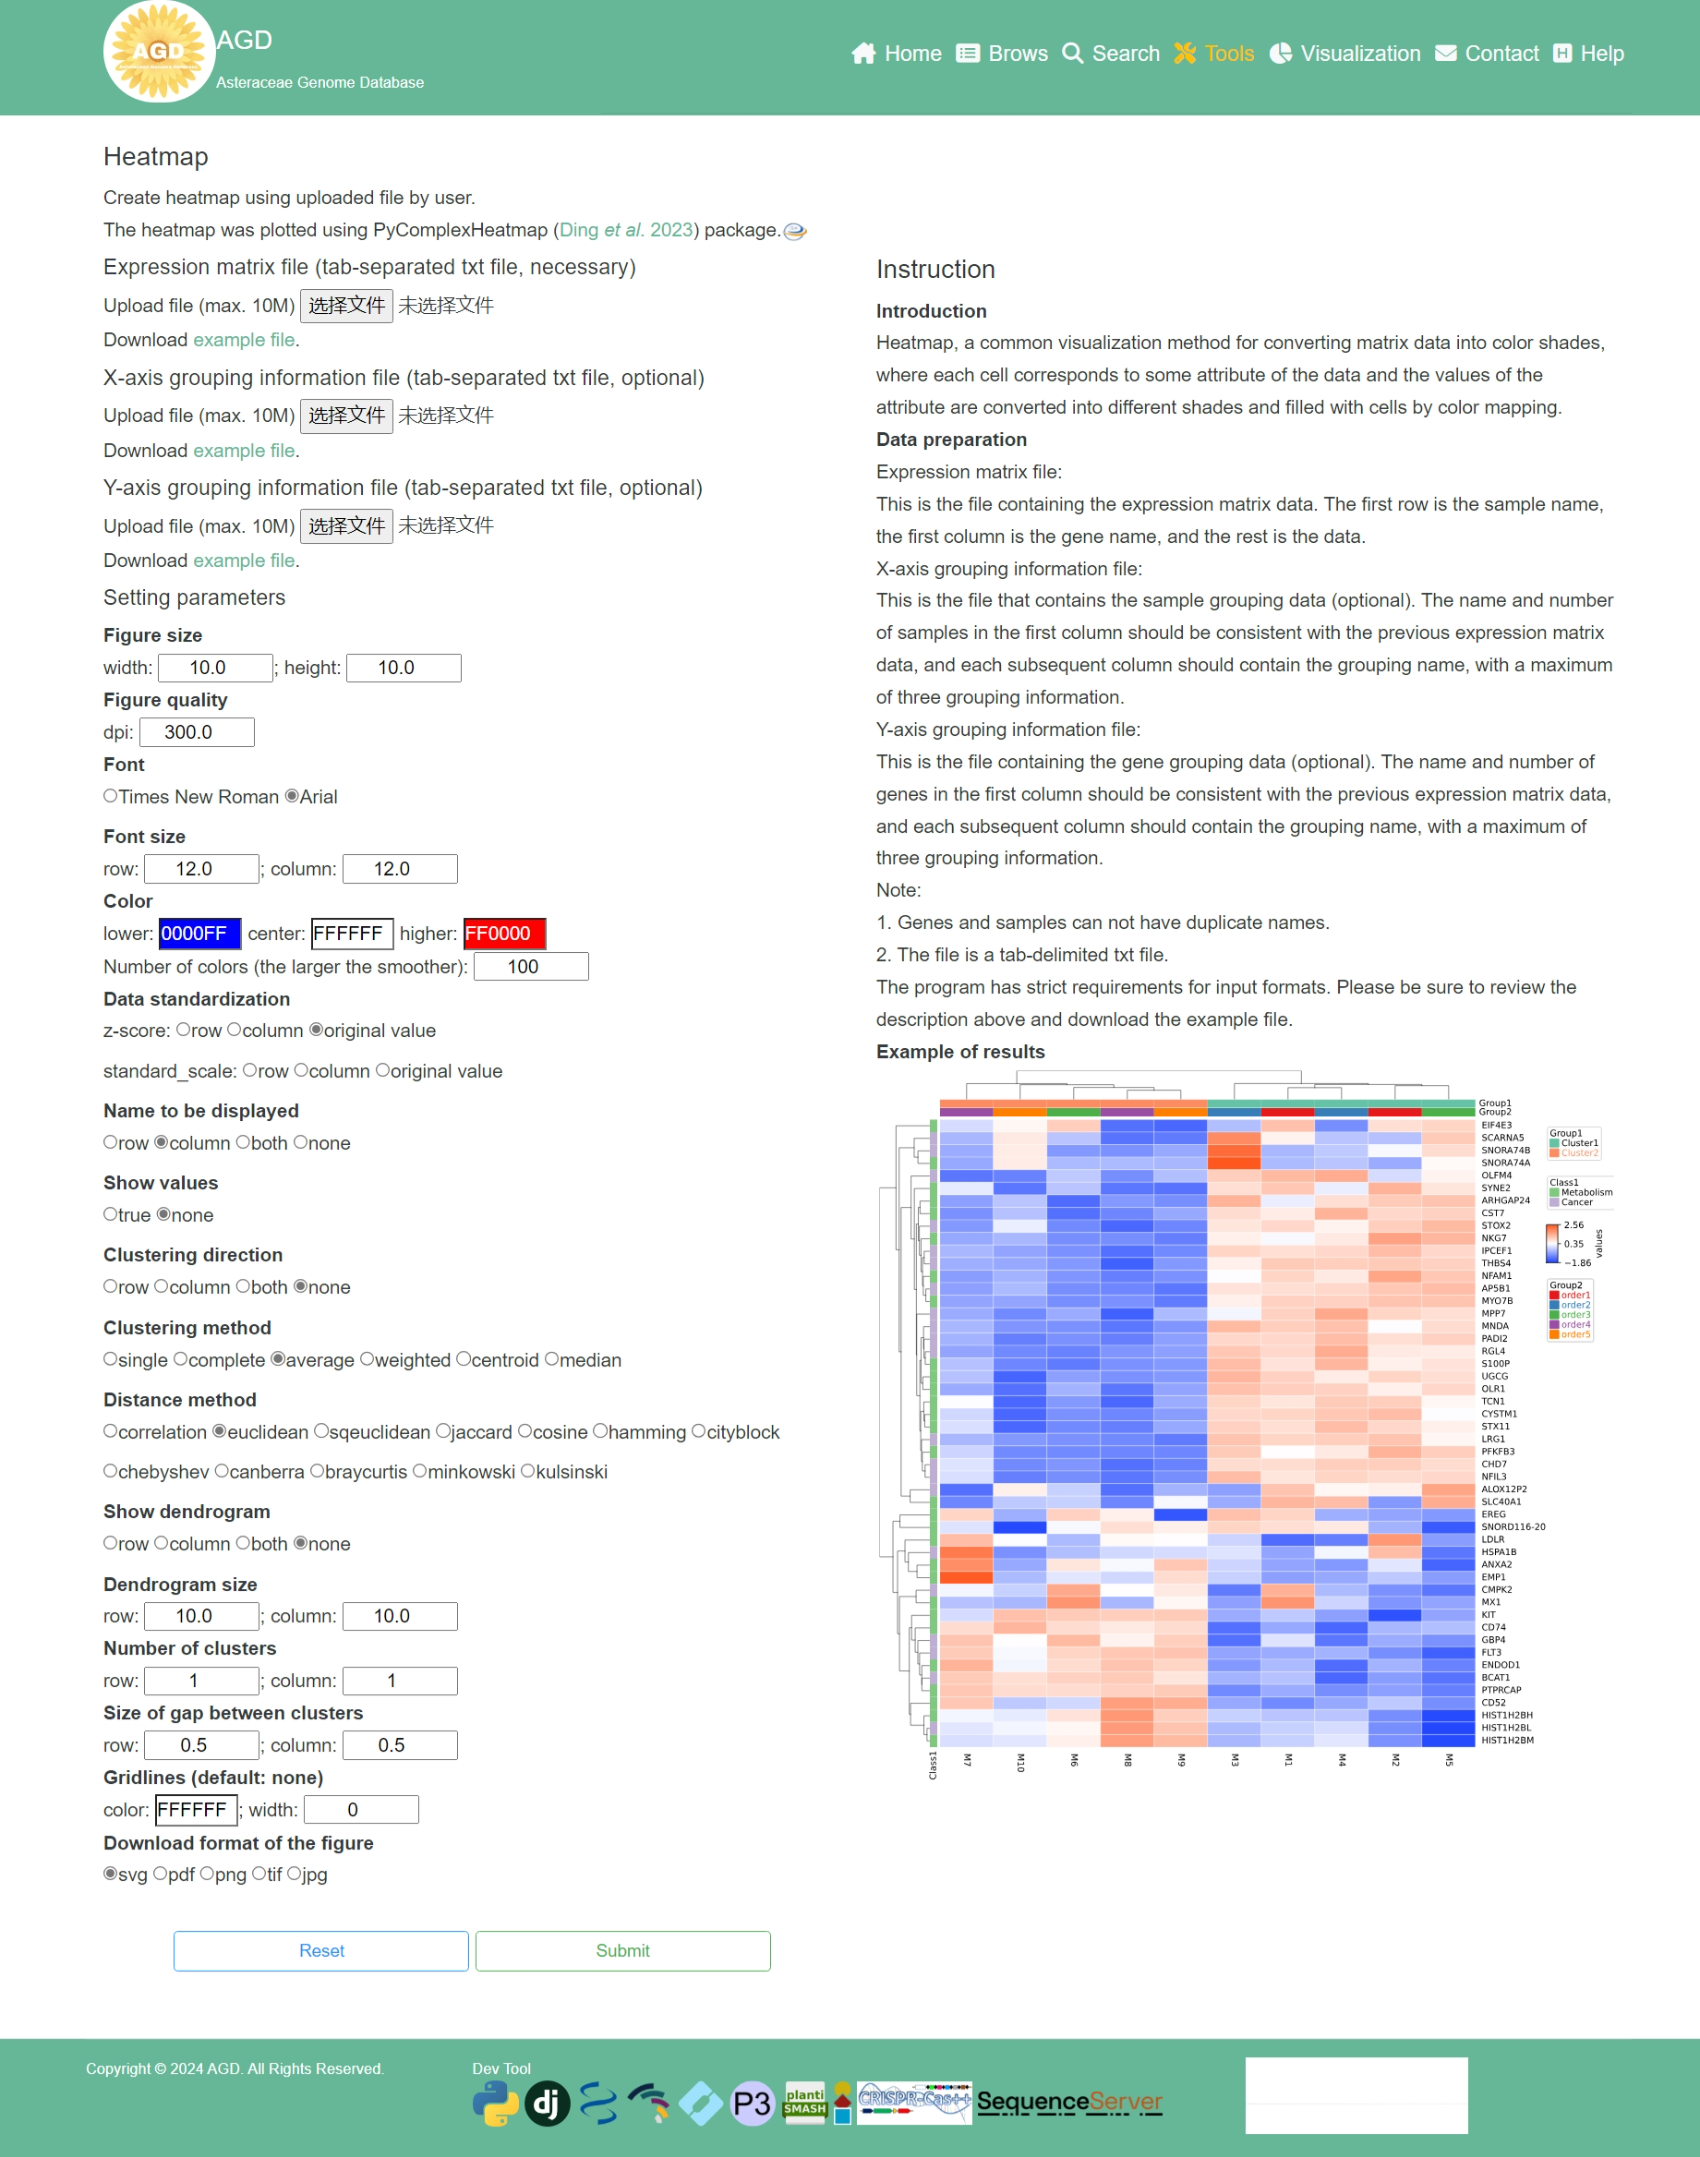
Step 1. Upload an expression matrix file
To perform the Heatmap, users need to upload an expression matrix file (<10Mb).
X-axis and Y-axis grouping information file are optional.
Note:The file must be tab-delimited txt file.
Step 2. Setting the plotting parameters
After uploading the expression matrix file, users need to setting the plotting parameters.
Step 3. Perform Heatmap
When the above steps are completed, users can click the "Submit" button to plotting a
heatmap.
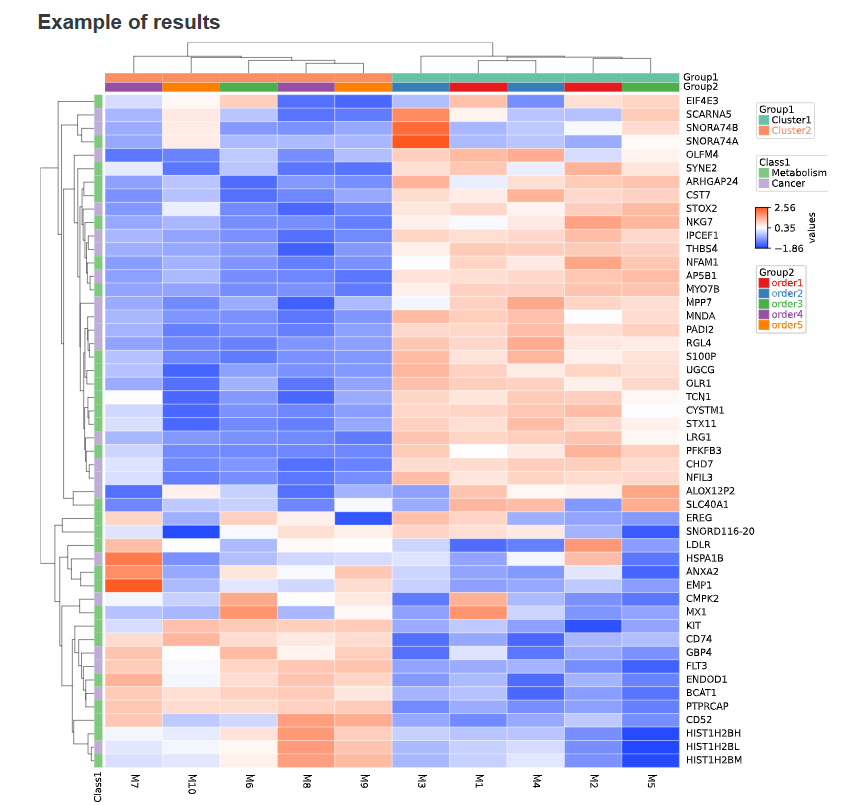
When the heatmap is finished, it will be displayed in the top right corner of the page.
3-5-2 Result
Users can download the obtained heatmap by clicking on the 'Download' button below the image.
3-6 Primer3
AGD provides a simple and reliable way for users to better automate the design of primers.
3-6-1 Perform
The following shows the interface to run Primer3, users only need three steps to perform Primer3.
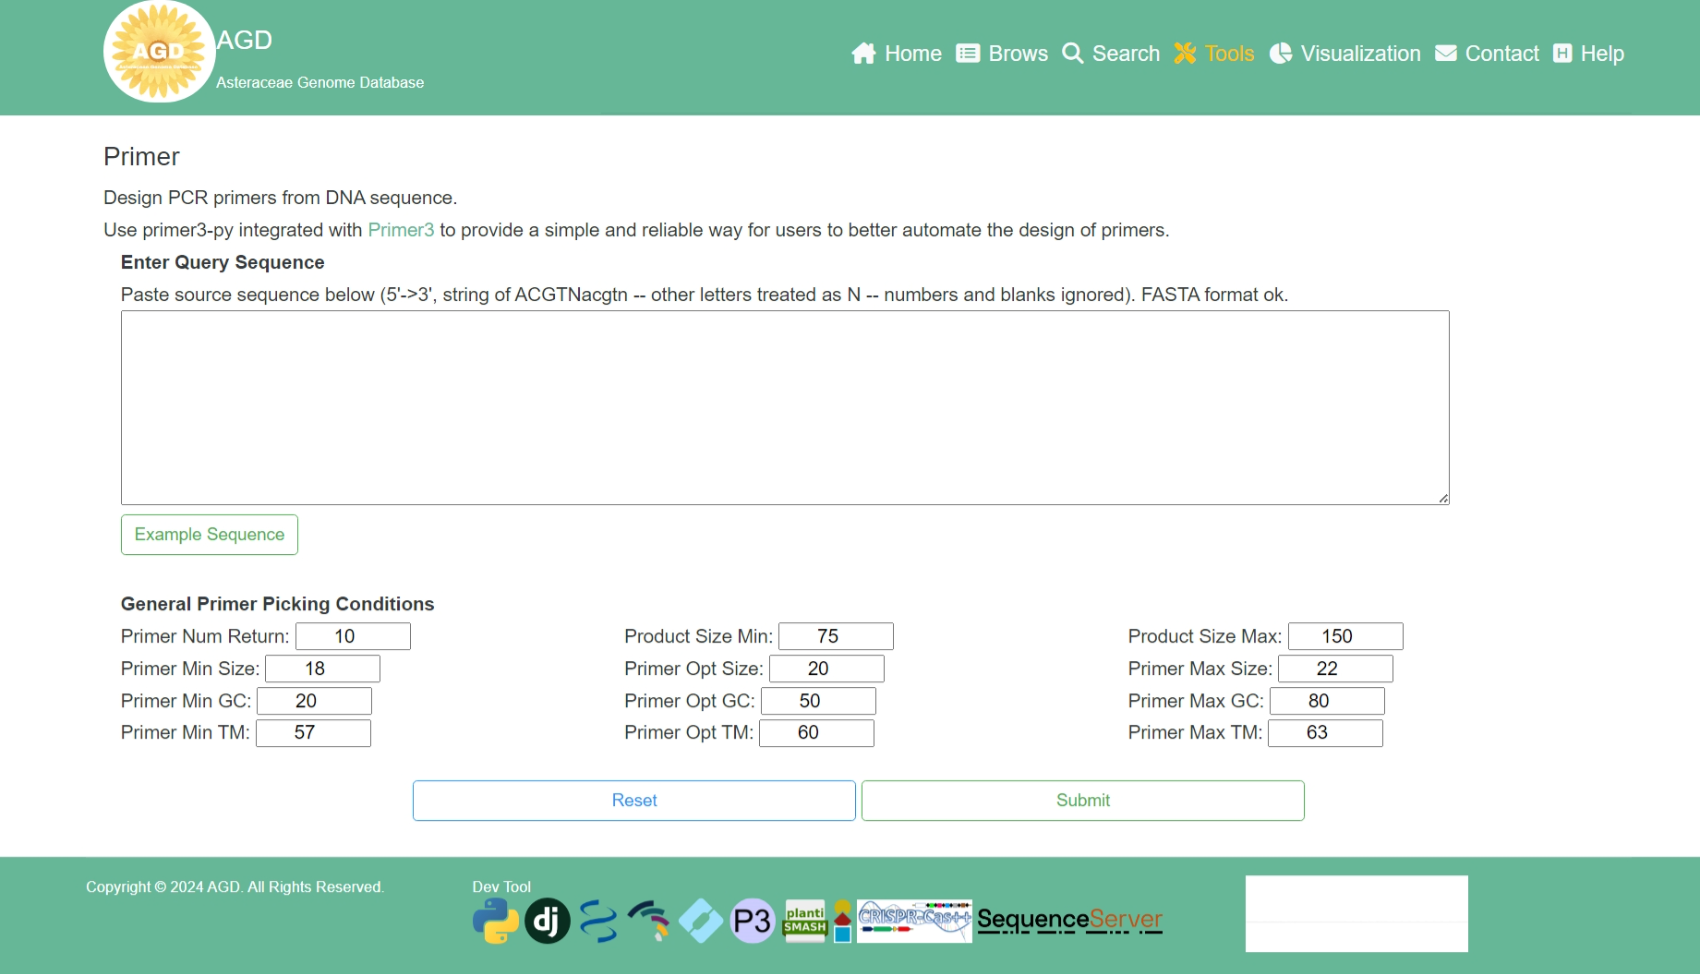
Step 1. Input the query sequence
To perform the Primer3, users need to input the query sequence.
Step 2. Setting the parameters
After input the query sequence, users need to setting the general primer picking conditions.
Step 3. Perform Primer3
When the above steps are completed, users can click the "Submit" button to design PCR primers from the input sequence.
After the analysis is done, the results are displayed in a table at the bottom of the page.
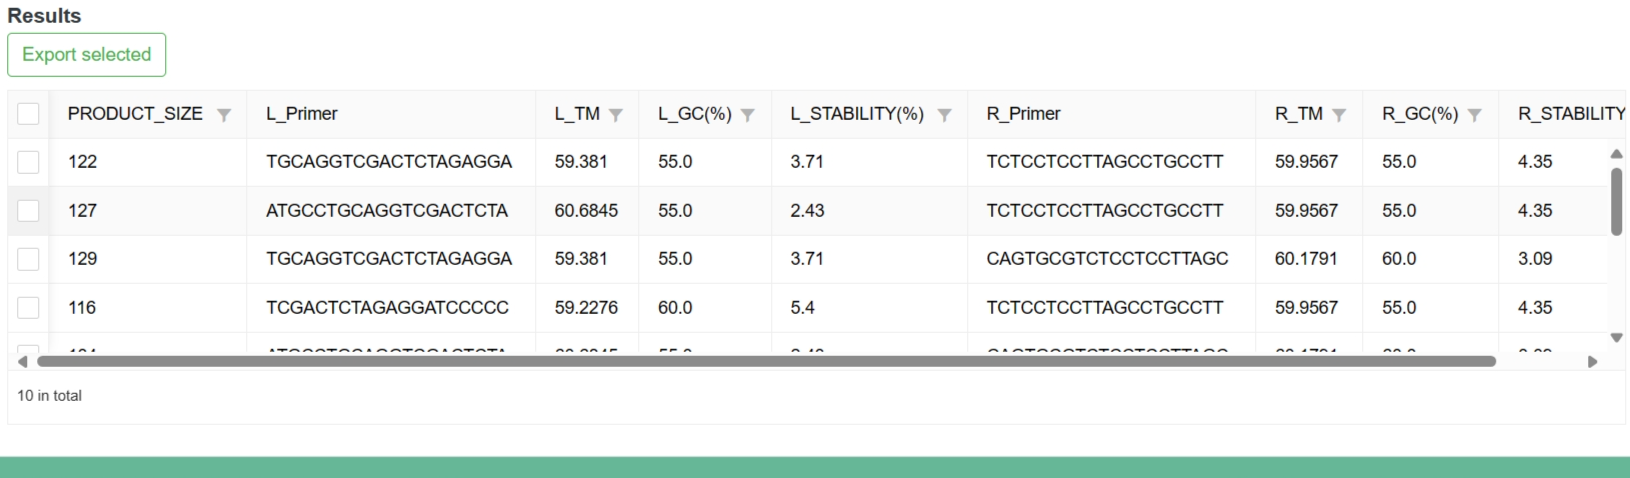
3-6-2 Result
Users can export the results of interest.
3-7 PlantiSMASH
AGD identified known clusters of secondary metabolic genes in all available chromosome-level genomes using plantiSMASH. Users can click "View details" to view all biosynthetic gene clusters in the genome of interest.
3-8 CRISPRCasFinder
AGD uses CRISPRCasFinder to identify CRISPR arrays and Cas proteins in user submitted sequences.
3-9-1 Perform
The following shows the interface to run CRISPRCasFinder, users only need three steps to perform CRISPRCasFinder.
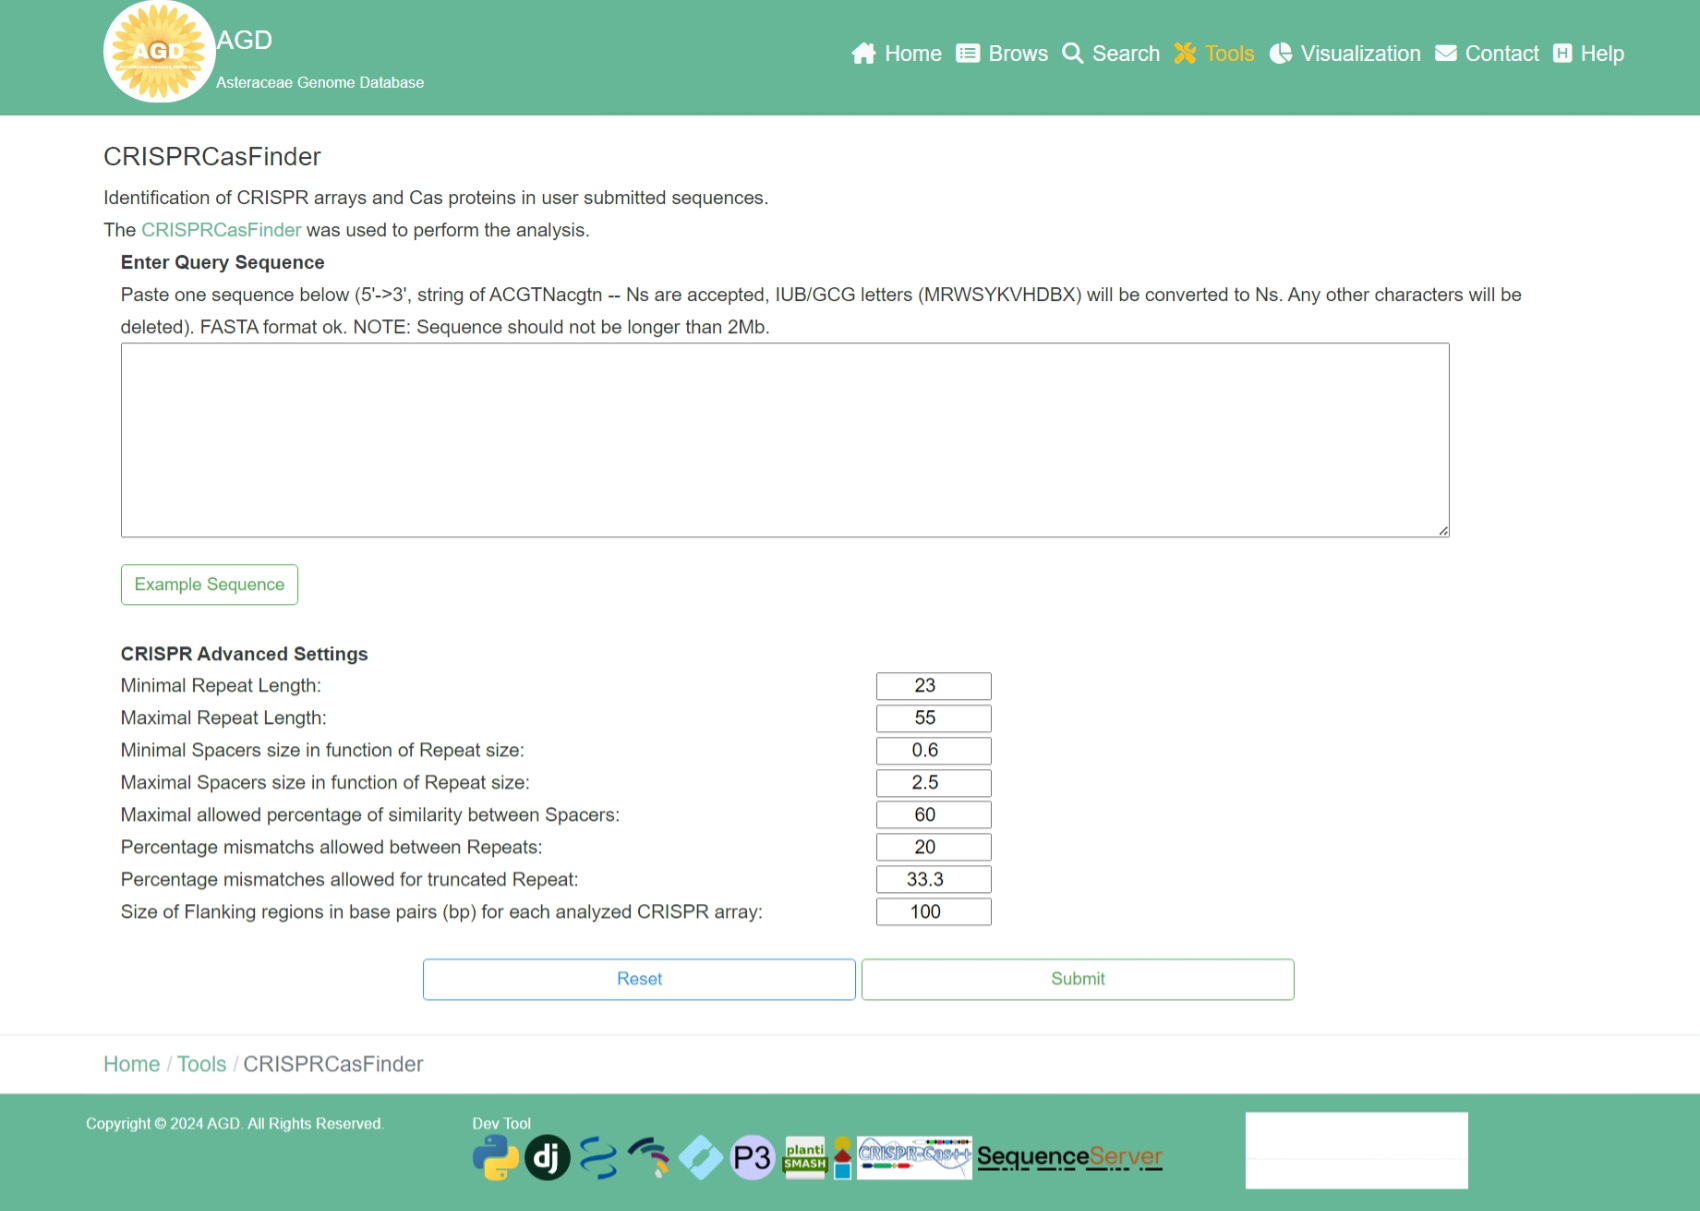
Step 1. Input the query sequence
To perform the CRISPRCasFinder, users need to input the query sequence.
Step 2. Setting the parameters
After input the query sequence, users need to setting the advanced parameters.
Step 3. Perform CRISPRCasFinder
When the above steps are completed, users can click the "Submit" button to identify CRISPR arrays and Cas proteins from the input sequence.
After the analysis is done, the results are displayed at the bottom of the page.
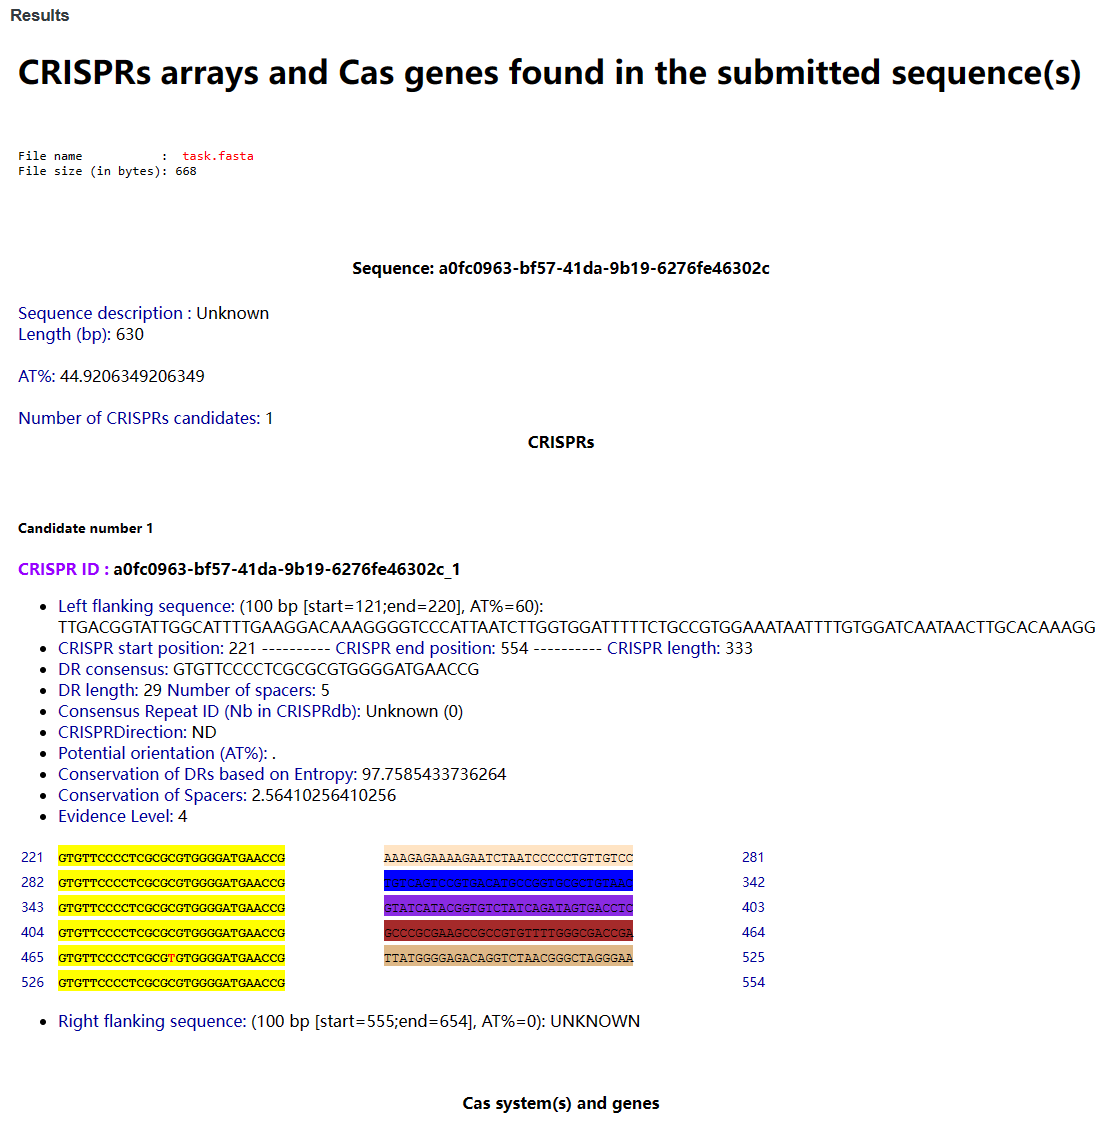
3-9-2 Result
Users can view all CRISPR sequences and Cas proteins identified.
4 Visualization
To better show what is inside AGD, we have created some data visualizations. Users can view them through the visualization buttons on the toolbar. It will serve as a starting point for users to explore the database. Above each chart is a short description of how to use the visualization tools.
|
|
|
|
|
|
|
|

|
|
|